
Bullish For Bitcoin: This Level Needs to Fall for a New All-Time High (BTC Price Analysis)
Following a bullish surge towards the $71K threshold, Bitcoin faced heightened selling pressure, leading to a slight bearish rejection.
However, the cryptocurrency encounters a robust support region that may lead to a renewed bullish move in the short term.
Technical Analysis
By Shayan
The Daily Chart
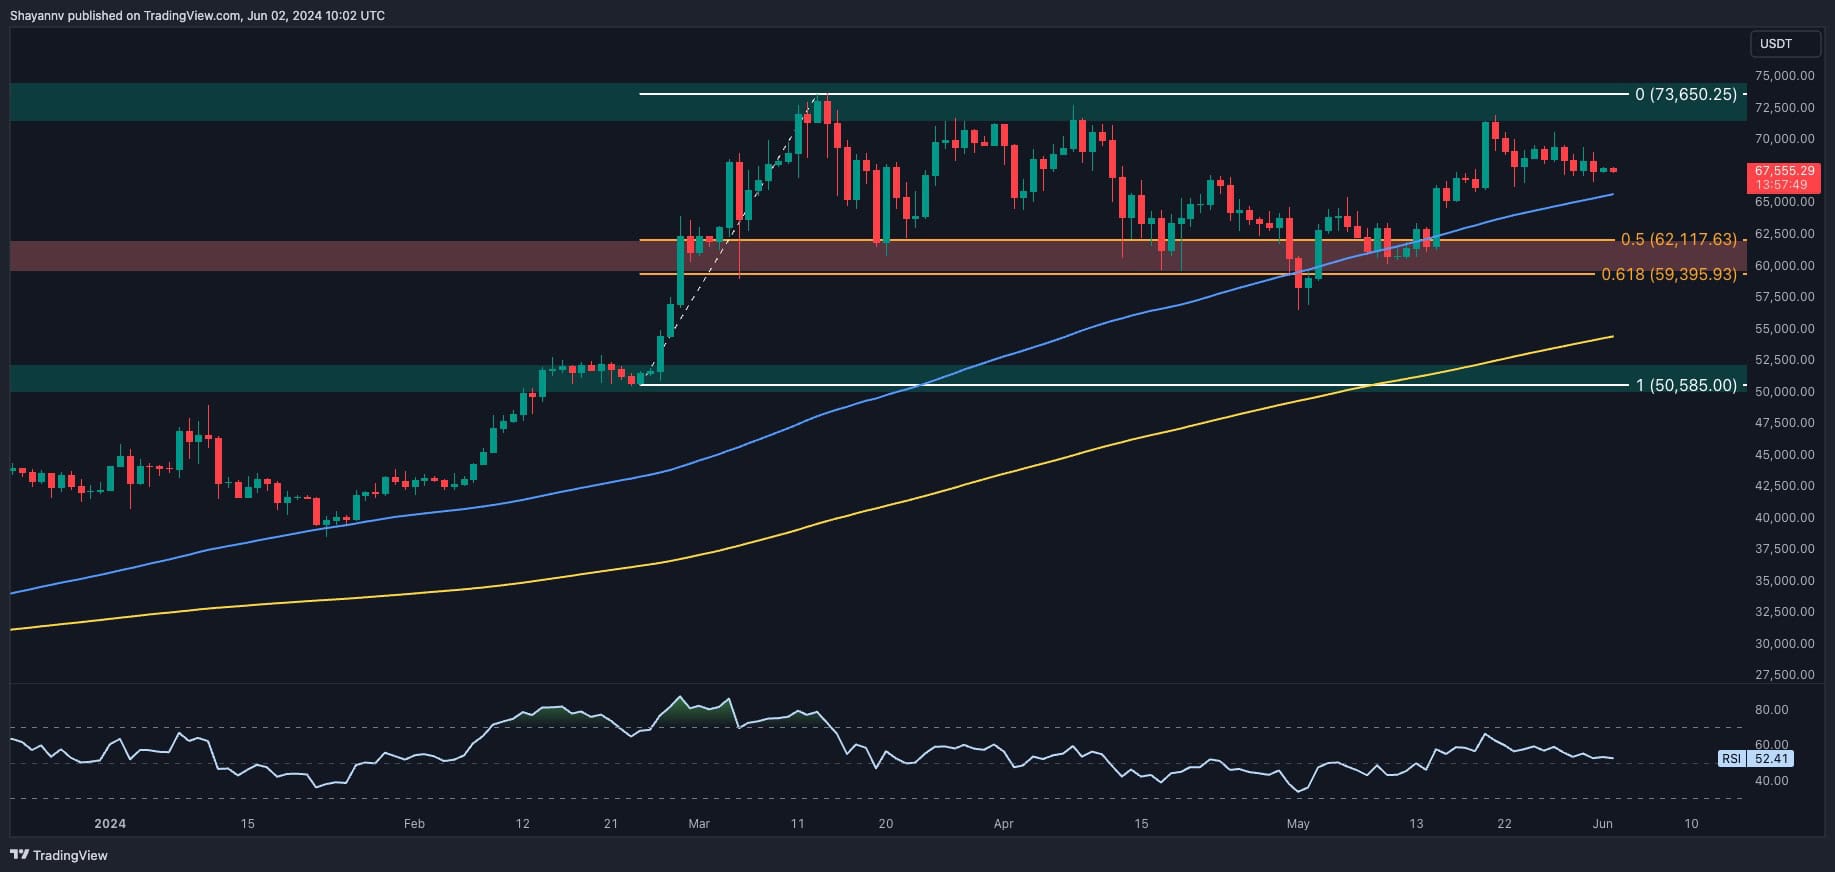
A detailed analysis of the daily chart reveals that after a resurgence in demand and a bullish spike towards the $72K significant resistance region, Bitcoin encountered selling pressure, leading to a slight bearish retracement. The $72K-$74K price range holds significant importance, serving as a formidable resistance that has halted several upward attempts in recent months.
On the other hand, the substantial 100-day moving average at $66K acts as a crucial support region. This MA is accompanied by notable demand, potentially halting further selling pressures. Nevertheless, Bitcoin’s price is confined between the 100-day MA and the $72K resistance region, with an impending breakout necessary to initiate a robust price trend.

The 4-Hour Chart
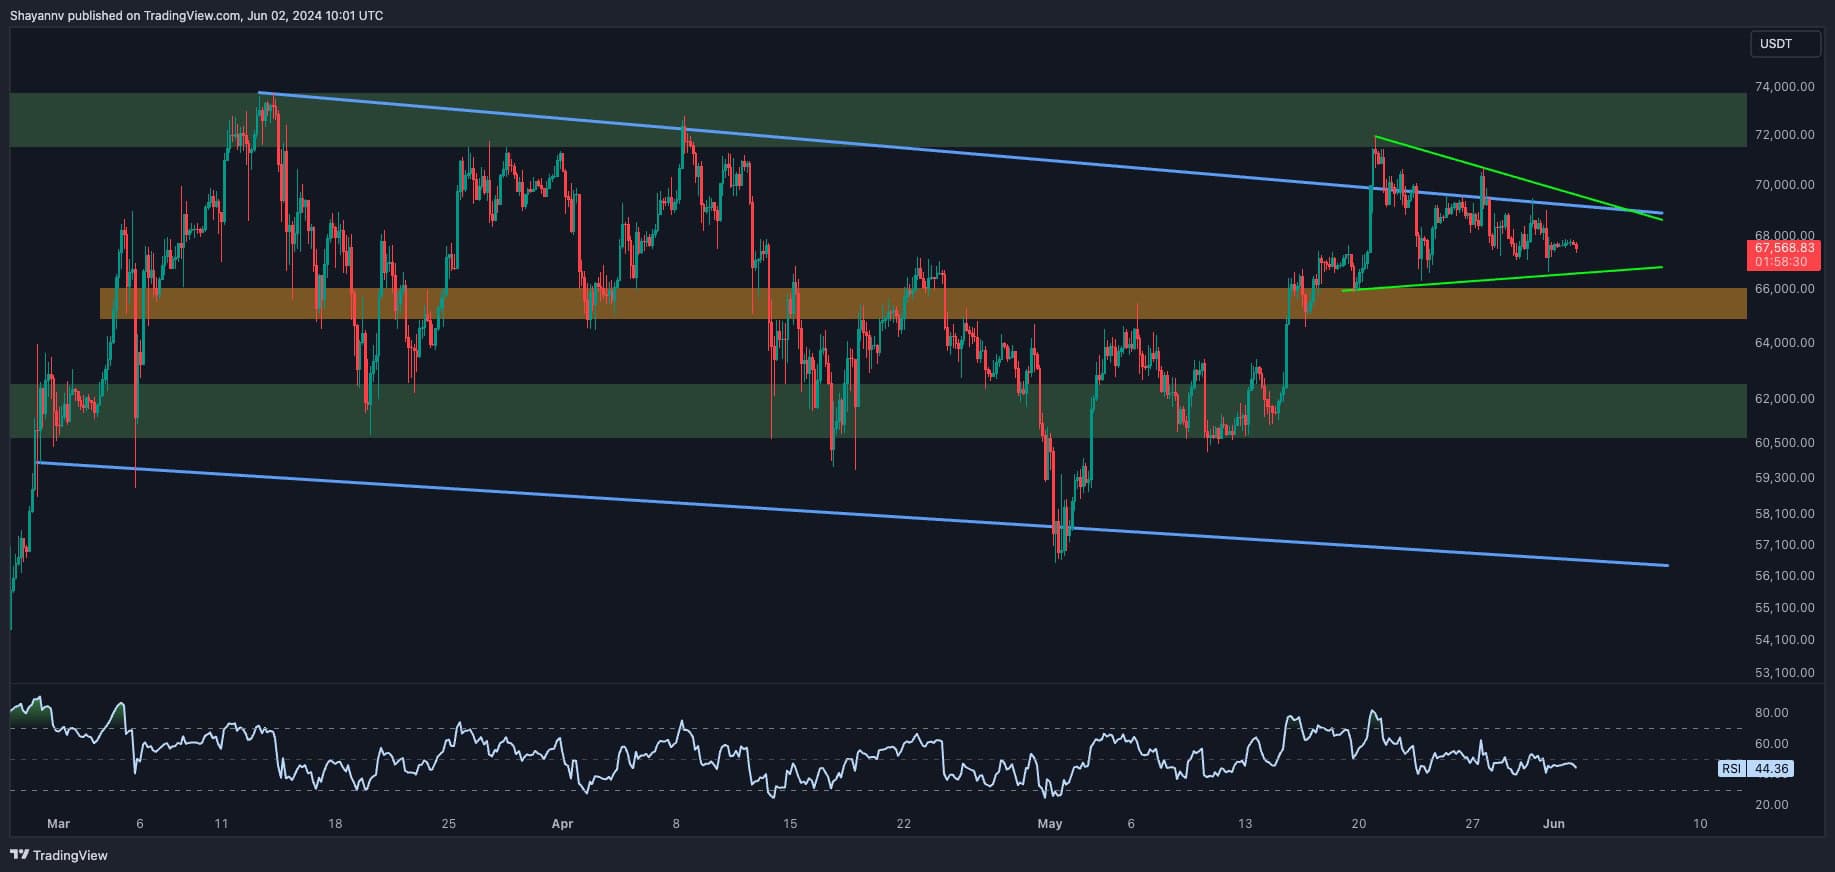
On the 4-hour chart, after an increase in buying pressure drove Bitcoin’s price up to $72K, the cryptocurrency reached the upper boundary of a multi-month descending wedge. However, significant supply in this crucial range caused the bullish momentum to fade, resulting in a slight rejection and sideways consolidation correction.
Currently, Bitcoin has formed a smaller wedge pattern near the upper boundary of $70K, with the price approaching its narrow range. Should Bitcoin surpass the upper boundary of the wedge, it may indicate a prolonged bullish trend, with the key $74K resistance zone as its target.
Currently, the price is restricted within a narrow range defined by the wedge pattern. An imminent breakout from this range will shape Bitcoin’s forthcoming path.
On-chain Analysis
By Shayan
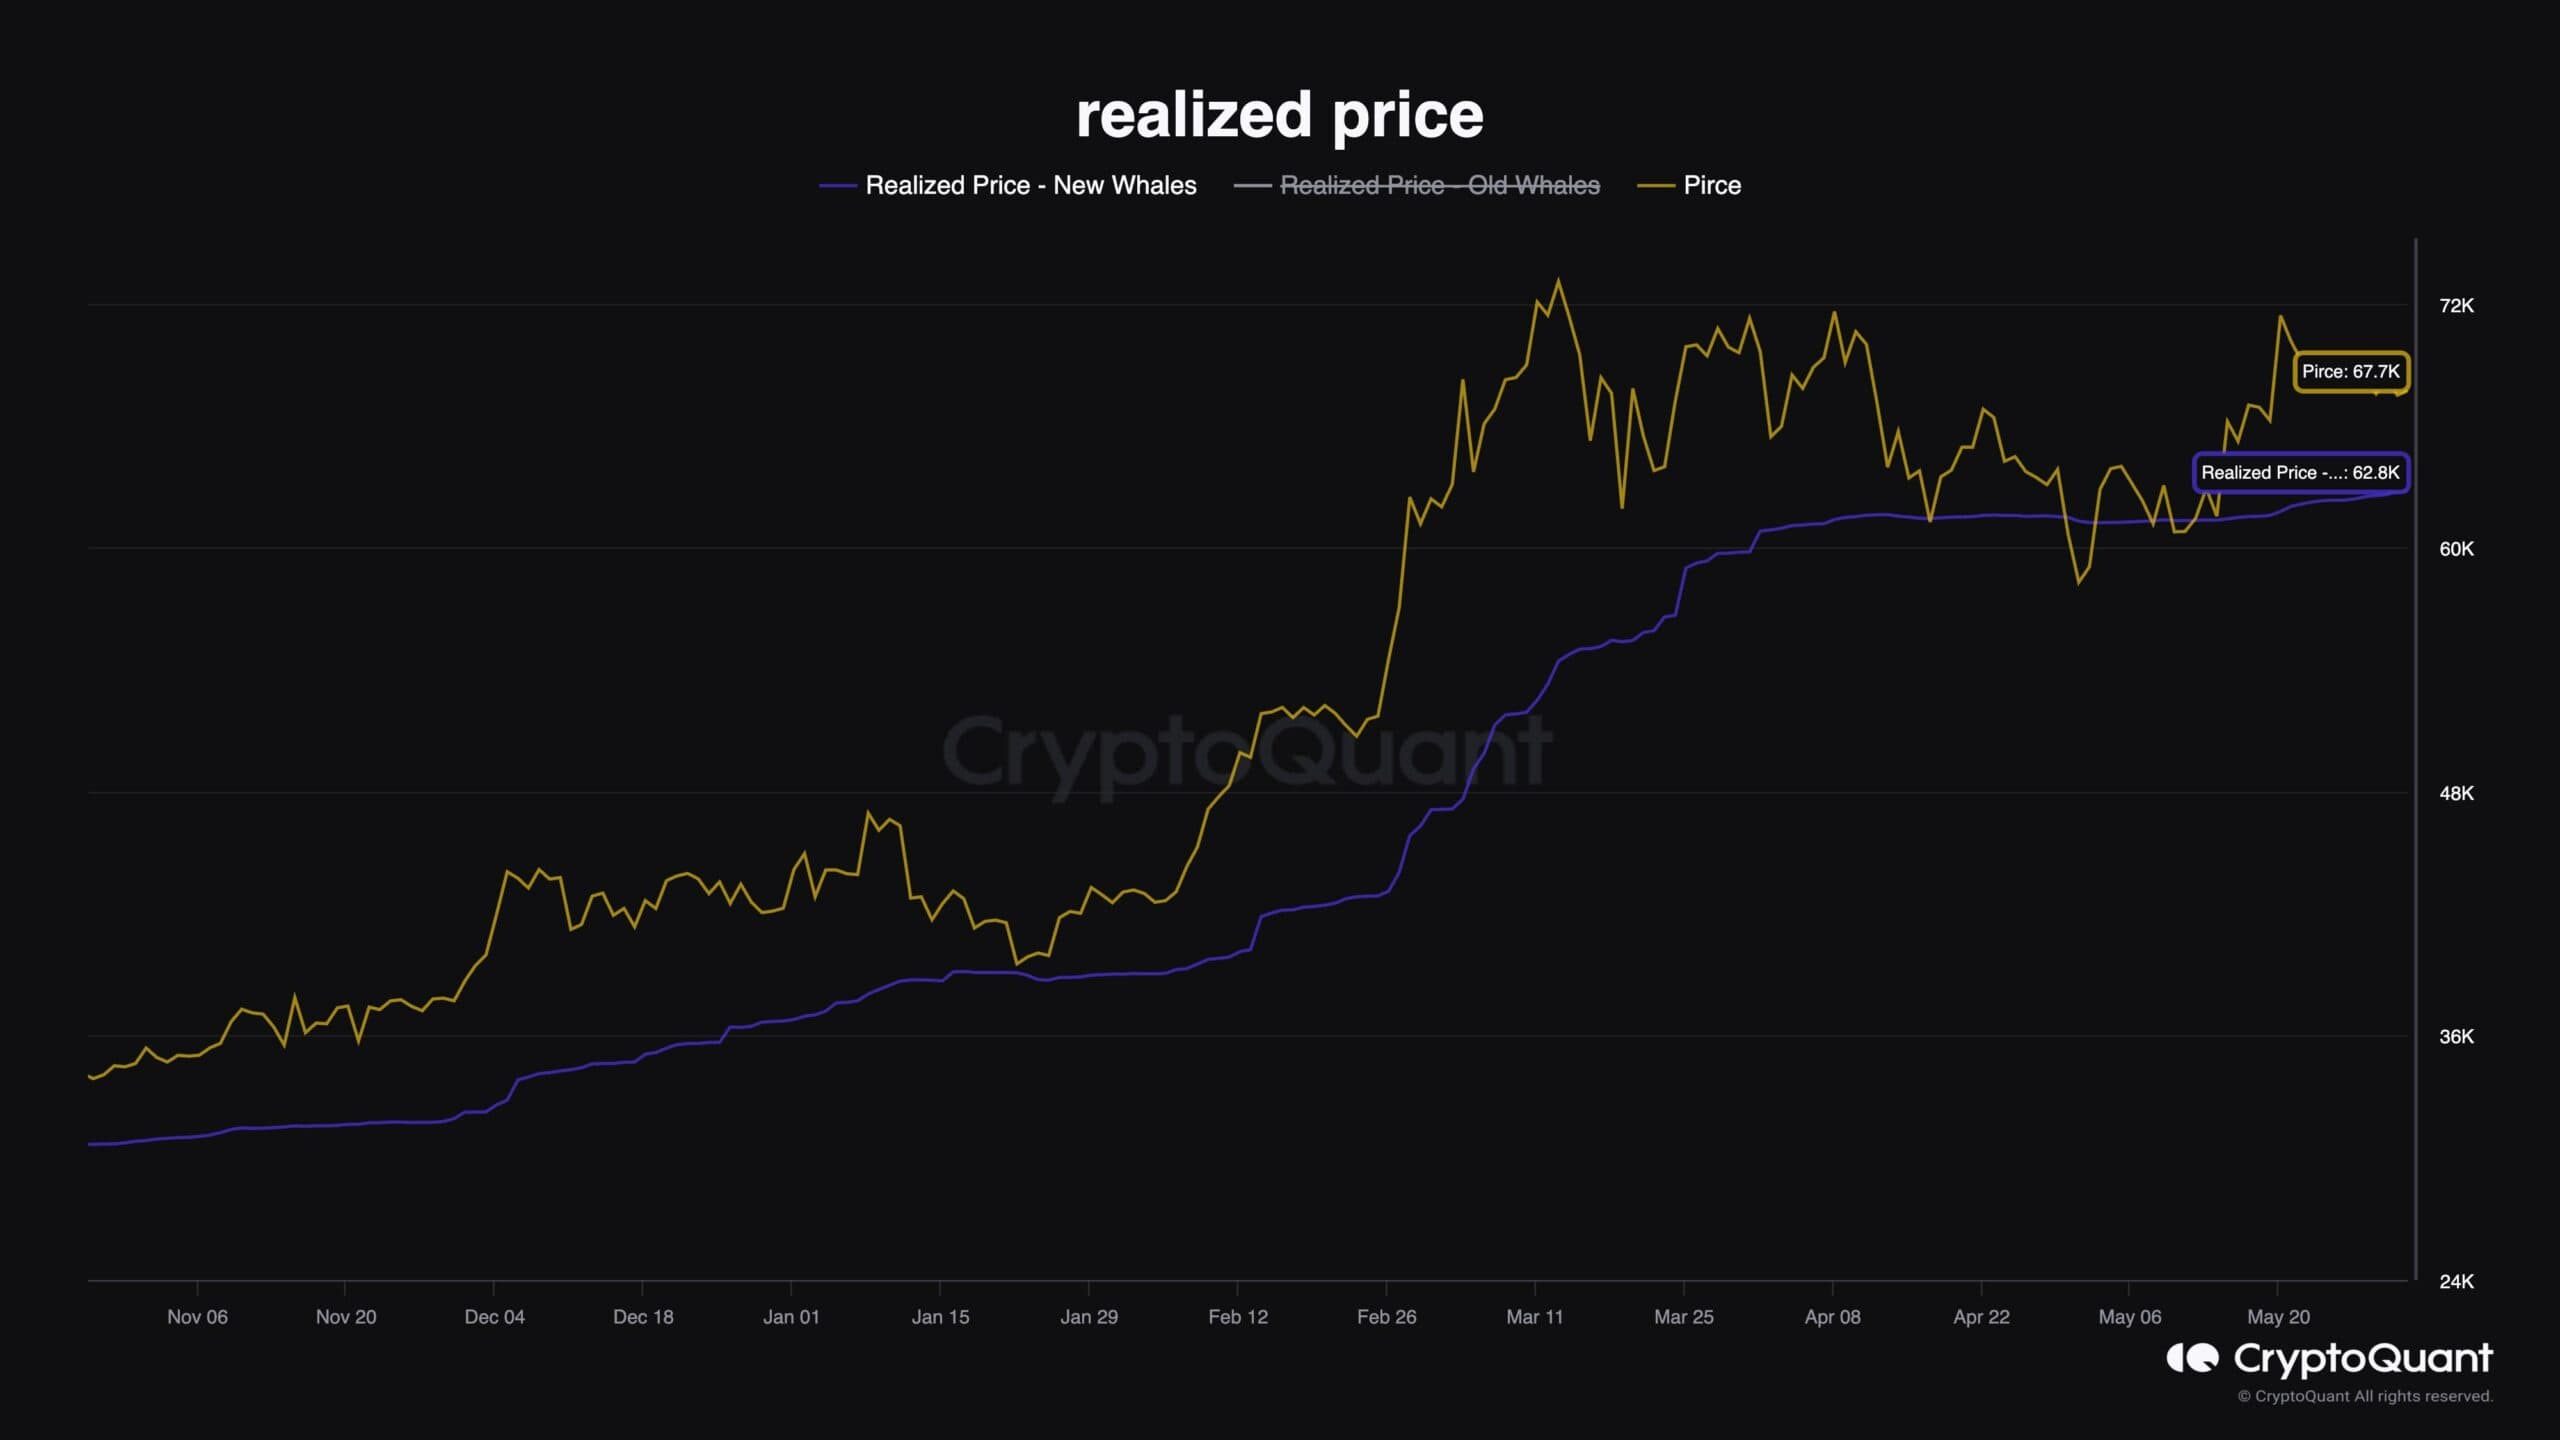
Whales are among the most influential participants in the crypto markets, holding substantial positions that can significantly impact price movements. Analyzing the profitability of these players provides valuable insights into market sentiment and conditions. The provided chart illustrates the realized price metric for the old whale cohort, reflecting the proportion of Bitcoin supply in profit.
The chart demonstrates that the realized price of new whales has consistently acted as significant support for Bitcoin throughout the recent bullish trend toward the all-time high (ATH) of $74K. During the recent rejection from the $74K mark, the realized price of new whales has supported Bitcoin significantly, contributing to a robust surge. Consequently, the realized price of new whales, approximately $62.8K, now serves as a key support region for Bitcoin buyers in the short term.
The profitability of new whales, as reflected in the realized price metric, suggests that these influential market participants continue to see value in Bitcoin above this support level. This sentiment underpins a bullish outlook as long as the price remains above $62.8K.
The post Bullish For Bitcoin: This Level Needs to Fall for a New All-Time High (BTC Price Analysis) appeared first on CryptoPotato.
Powered by WPeMatico