


Ripple Price Analysis: XRP Bear Trend Continues – Is a Drop to $1.20 Inevitable?
XRP remains in a corrective phase across both USD and BTC pairs, with recent strength fading back into established resistance and trend filters. The price action is now testing whether the early-January rebound was merely a short-covering rally within a broader downtrend or the start of a more durable base.
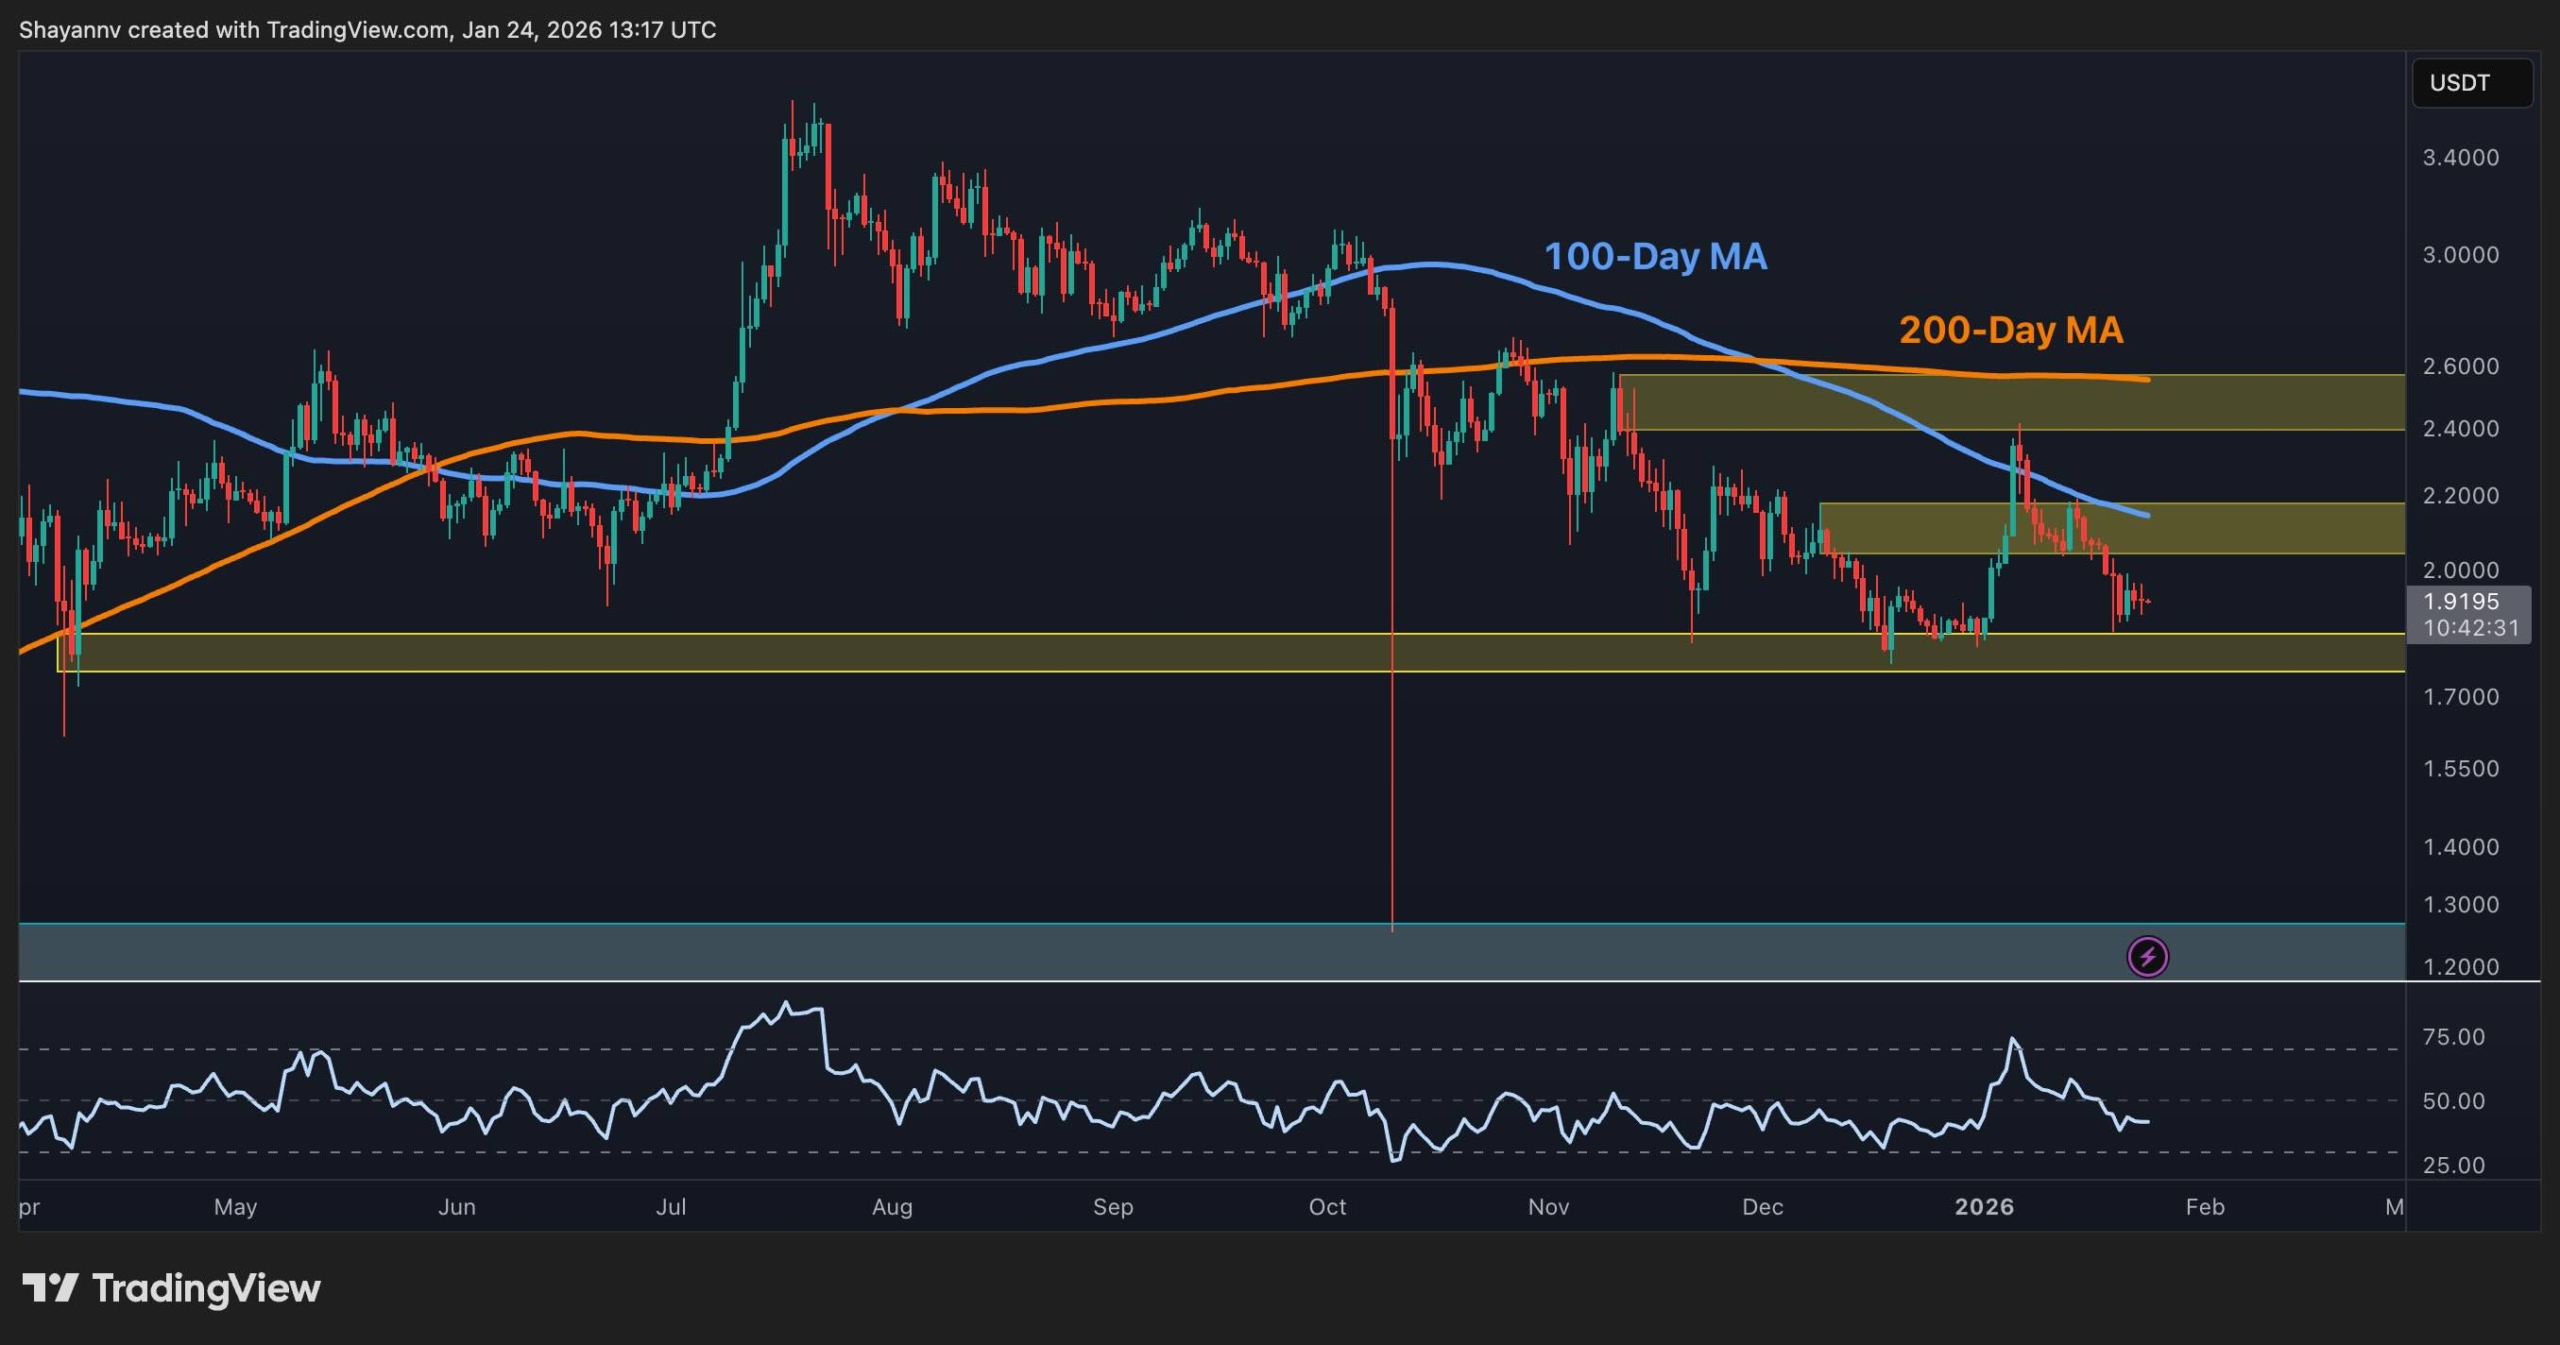
Ripple Price Analysis: The USDT Pair
On the daily chart, XRP/USDT is trading just above the major horizontal demand zone around $1.80–$1.90 after being rejected from the $2.40 supply band and the declining 100-day and 200-day moving averages. The moving averages continue to slope lower, confirming a medium-term bearish bias, while daily RSI has cooled from overbought levels back toward neutral, consistent with a fading bounce.
As long as the $1.80–$1.90 floor holds, the structure can still evolve into a basing range, with $2.20–$2.40 as the first upside threshold that must be reclaimed to argue for trend reversal; a decisive daily close below $1.80 would instead open room toward the October capitulation lows around $1.60 and, if pressure persists, the higher-timeframe lower demand zone near $1.20–$1.30.
The BTC Pair
Against Bitcoin, the XRP/BTC pair is hovering around 2,100–2,200 sats mark after a sharp rejection from the 2,400 sats resistance band and the cluster of the 100-day and 200-day moving averages. The pair remains locked in a structural downtrend, with each rally into the 2,400–2,500 sats area repeatedly sold and momentum failing to establish higher highs.
The lower support zone lies around 1,900–2,000 sats, where a recent downside wick indicates some demand, but until daily closes reclaim at least the 2,400–2,500 sats region and the key moving averages, relative performance continues to favor BTC. A breakdown below 1,800 sats would confirm renewed underperformance and could extend the slide toward the prior major demand area closer to 1,500 sats.

The post Ripple Price Analysis: XRP Bear Trend Continues – Is a Drop to $1.20 Inevitable? appeared first on CryptoPotato.
Powered by WPeMatico