


DOGE Dumps Hard, but History Suggests a Whopping $7 Target
Dogecoin is trading around $0.18 after dropping more than 29% over the past week. The asset is down by 9% in the past day alone.
Despite the decline, some analysts point to long-term price patterns that may repeat. If the structure follows past cycles, a sharp move higher could follow.
Dogecoin Follows Repeating Market Cycles
The chart from Bitcoinsensus shows three repeating cycles in Dogecoin’s history. Each starts with a large drop, followed by a long sideways phase, and then a strong rally.
$DOGE MONTHLY MACRO CYCLES
Could 7$ be next in this cycle?
Looking at previous price history on #Dogecoin, it has always followed the same market structure, finishing with a massive move at the end of the cycle.
If we were to repeat the same playbook, Doge could see… pic.twitter.com/eWlrPhKHvV
— Bitcoinsensus (@Bitcoinsensus) October 16, 2025


Cycle 1 raised the profit to over 5,800% at its close. Cycle 2’s growth was even bigger, as it exceeded 21,000% and hit $0.74 in 2021. Indications of Cycle 3 are visible already. Assuming the same scenario occurs again, the price may then go for $5 to $7. Up until now, the setup remains legitimate (even though unlikely), but a breakthrough has not occurred.
Weekly Chart Shows Possible Rebound Setup
A chart shared by Trader Tardigrade shows Dogecoin on a weekly view. It highlights a long lower wick, similar to those seen before earlier rallies.
The chart uses a wave structure, suggesting that DOGE may be nearing the end of a correction. If true, the next move could form wave five, leading to higher prices. The projected path shows a rise toward $1.50. For that to happen, the asset must stay above key support levels and push past resistance.
Another post from Trader Tardigrade shows Dogecoin in three stages: consolidation, slow trend, and parabolic move. The current phase is labeled as parabolic, based on rising lows and stronger price movement.
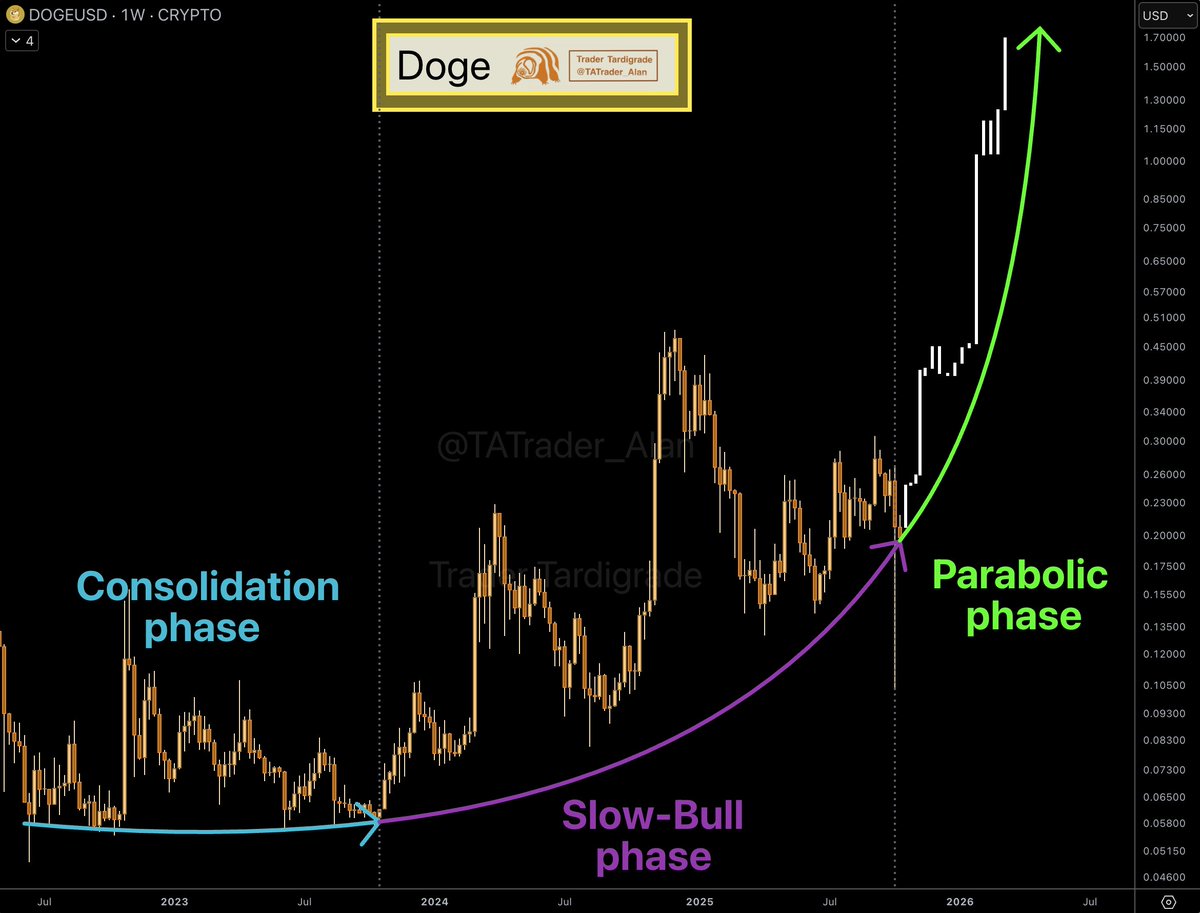
If the path holds, the chart points to a possible rise above $1. This move depends on continued strength and steady buying over time. The setup builds on the price history seen in earlier cycles.
Current Market Position
This week, Dogecoin has come out as the biggest loser among the top 20 cryptocurrencies. Its current price is approximately $0.18, accompanied by a 24-hour trading volume surpassing $3.6 billion.
However, the launch of House of Doge through a Nasdaq merger also adds to its longer-term presence in the market. Currently, traders are monitoring crucial points to determine if the formation will lead to a robust rise in price.
The post DOGE Dumps Hard, but History Suggests a Whopping $7 Target appeared first on CryptoPotato.
Powered by WPeMatico