Is XRP Preparing for a Massive Rally Above $0.7? (Ripple Price Analysis)
Ripple has been experiencing uncertain market activity, with the price lacking clear momentum.
However, the price has now reached a critical and narrow range, with a breakout being essential to establish a definitive trend.
XRP Analysis
By Shayan
The Daily Chart
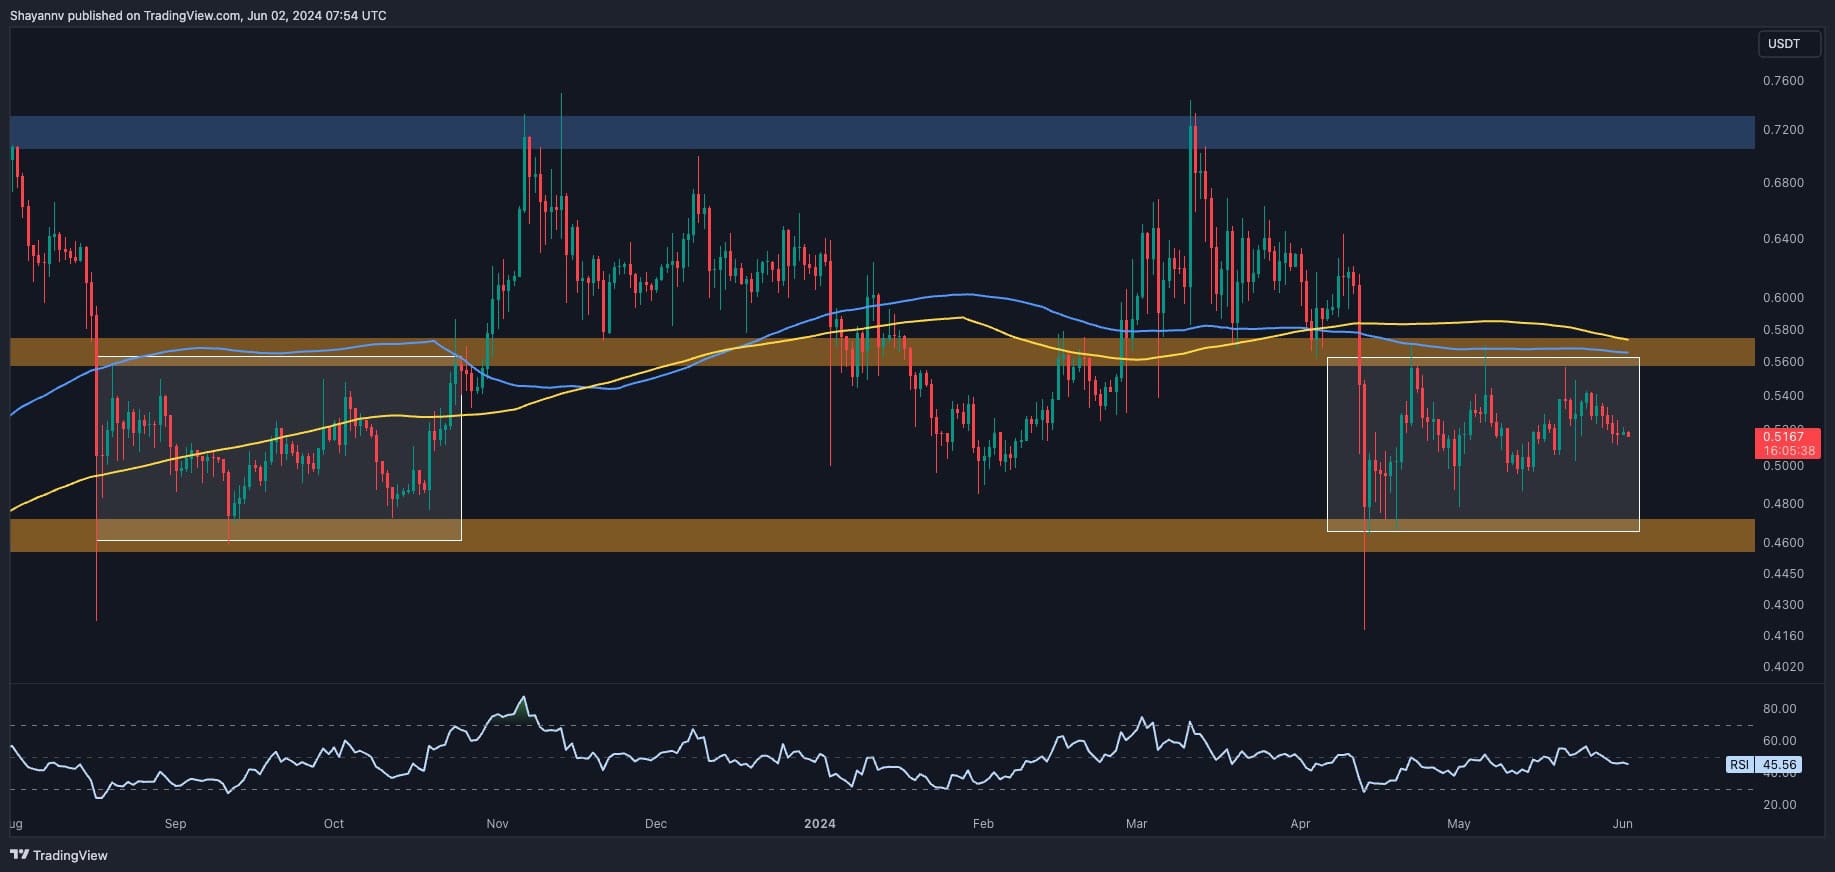
A detailed look at the daily chart reveals that Ripple’s price has been confined within a critical range, bounded by key resistance at $0.55 and significant support at $0.47, leading to prolonged sideways price action. This pattern mirrors the behavior observed from August to November 2023, before Ripple embarked on an impulsive bullish surge toward the $0.73 resistance, reclaiming the 100-day and 200-day moving averages.
Currently, XRP is exhibiting similar price action within the same range, contending with a significant resistance zone that includes the range’s upper limit and the 200-day moving average.
If buyers break past this critical zone, a lasting upward trend might develop. Nevertheless, considering the existing supply and the lack of robust bullish pressure, a rejection appears more probable in the near term.

The 4-Hour Chart
On the 4-hour chart, Ripple’s price has faced extremely low volatility and market activity, resulting in muted price action. This indicates an uncertain state within the market regarding Ripple’s upcoming trajectory. The price has reached a narrow range, bounded by the 0.5 ($0.5310) Fibonacci level and the ascending wedge’s lower boundary at $0.51.
A break below the pattern’s lower trendline could lead to a bearish retracement towards the static support at $0.48.
Conversely, if buyers breach the 0.5 Fibonacci level, the next target will be the 0.618 ($0.5574) Fibonacci level in the short term. In conclusion, Ripple is at a crucial juncture, with a breakout from the current range needed to confirm the next trend direction.

The post Is XRP Preparing for a Massive Rally Above $0.7? (Ripple Price Analysis) appeared first on CryptoPotato.
Powered by WPeMatico


