Polkadot Price Analysis: DOT Soars 10% Weekly, Bear Trap Confirmed?
Polkadot has recently experienced increased buying activity near the $5.5 crucial support region, leading to a notable surge and breaking above the previously breached multi-month triangle’s lower boundary. This price movement indicates a false breakout and suggests a potential period of bullish retracements.
Technical Analysis
By Shayan
The Daily Chart
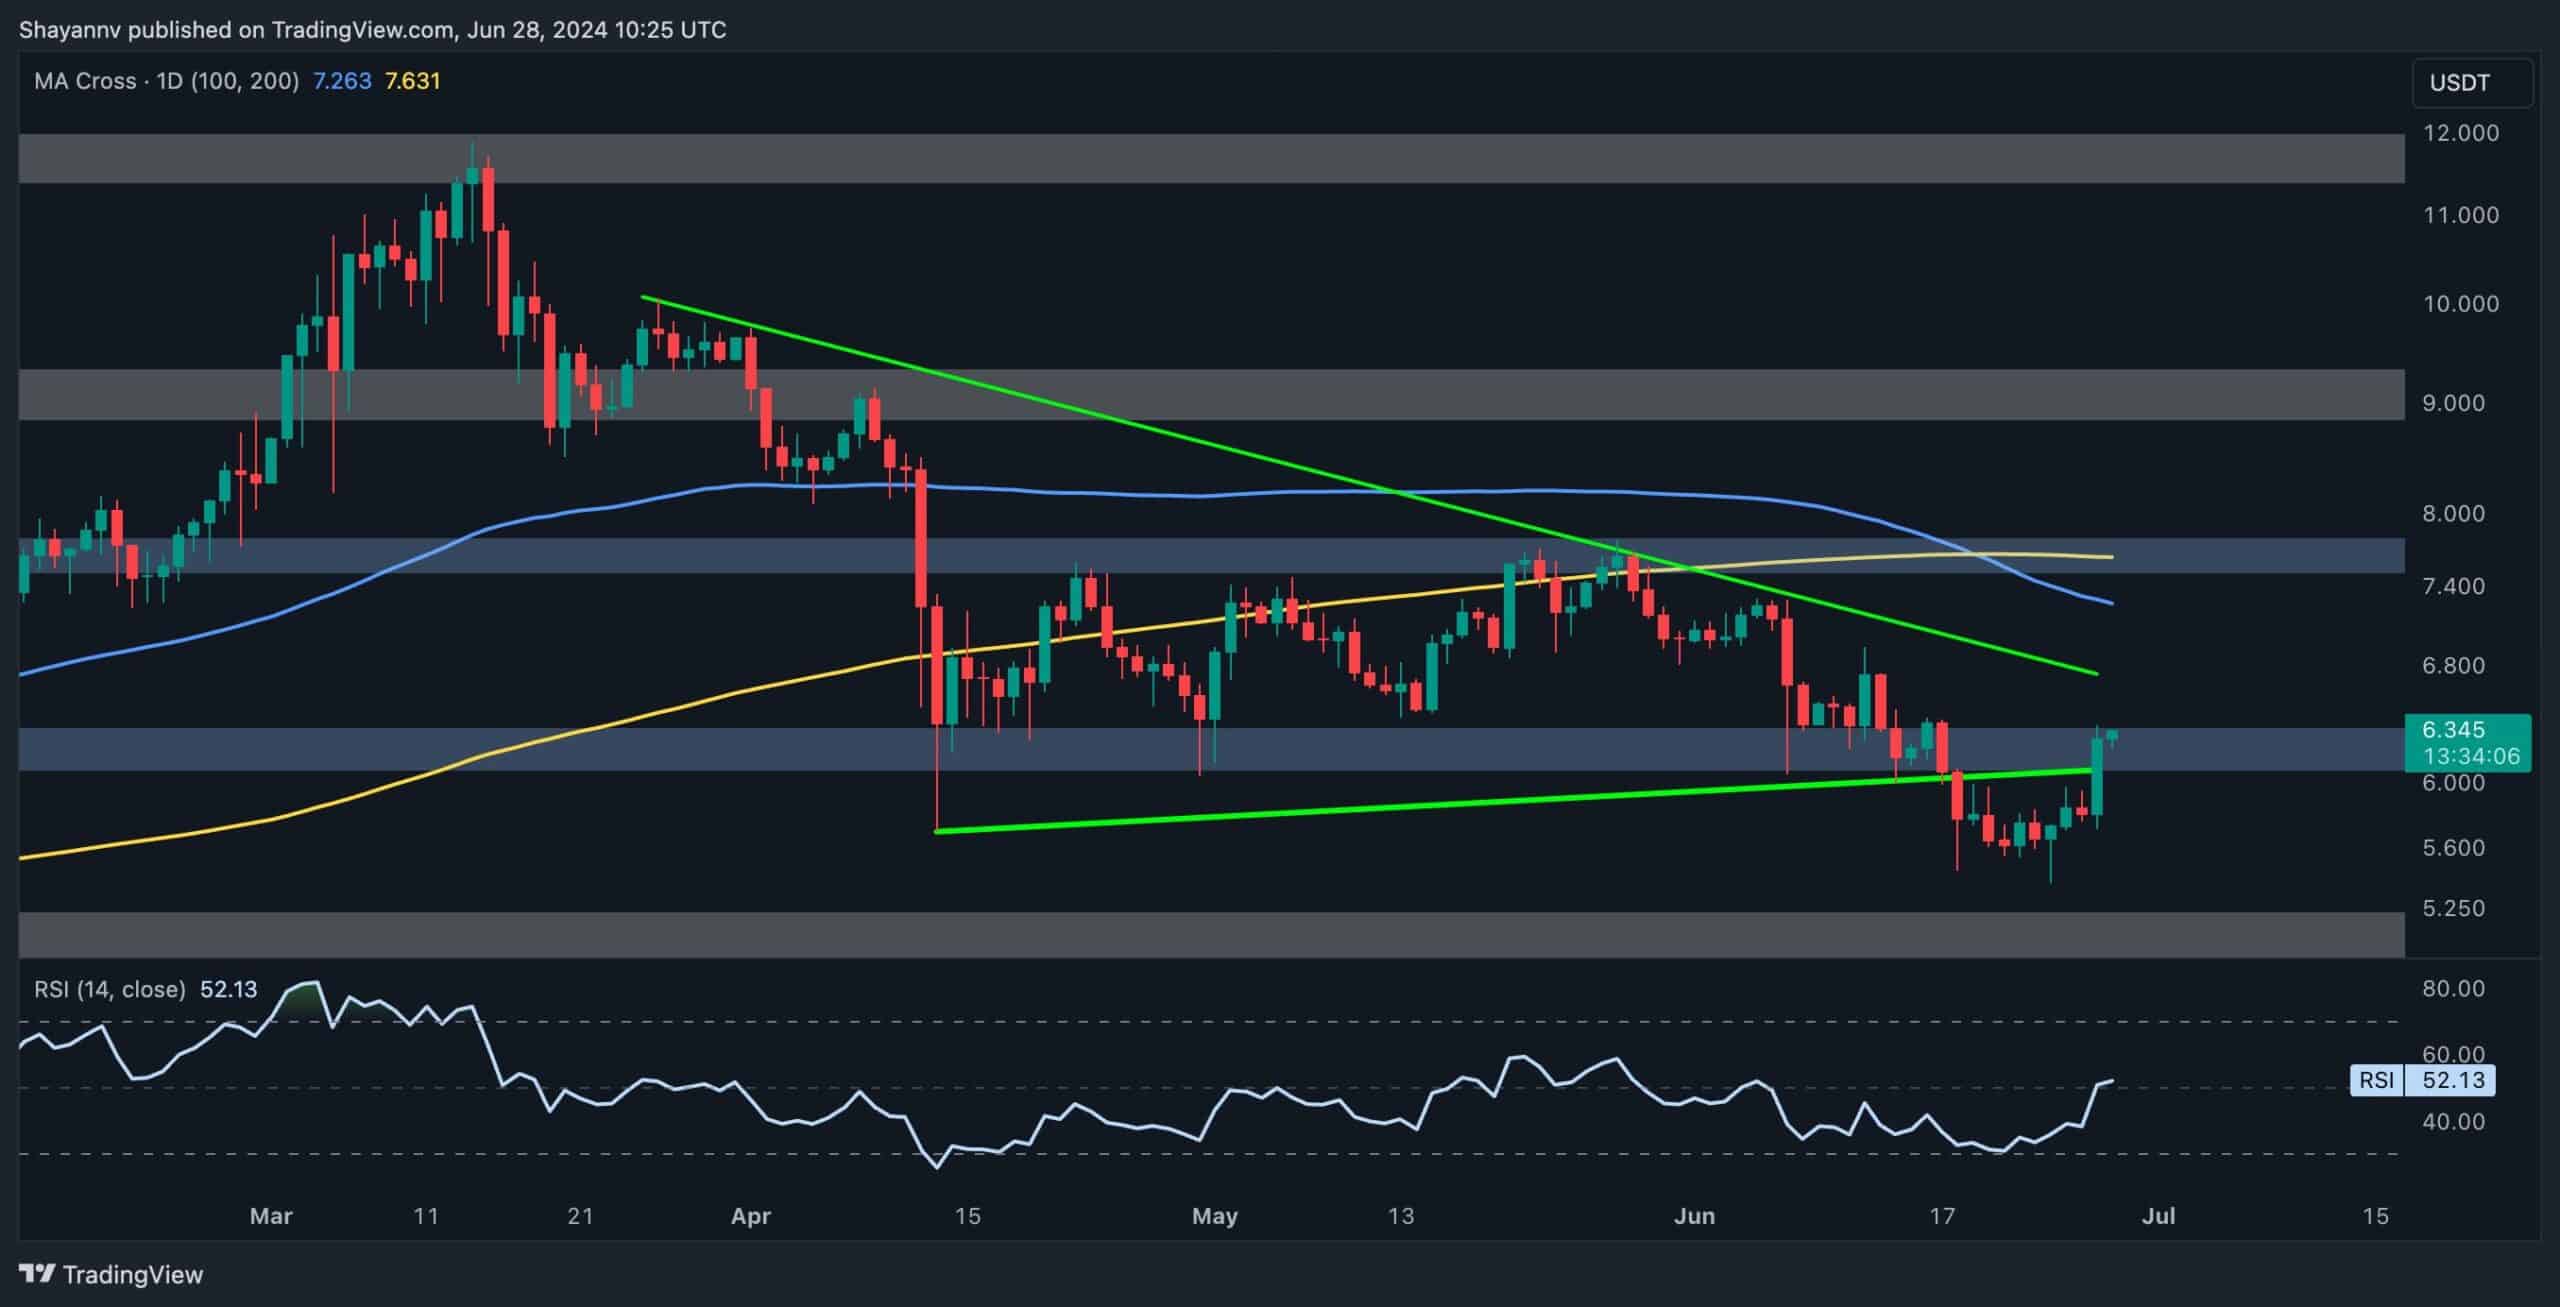
A detailed analysis of Polkadot’s daily chart reveals a significant bullish revival near the $5.5 support range. This area has seen intensified buying activity, resulting in a resurgence of demand and a notable surge in price.
As a result, Polkadot broke above the previously breached lower trendline of the multi-month triangle, signaling a false bearish breakout. This action suggests an increase in buying interest among market participants.
Currently, DOT faces a crucial resistance region at the $6.3 level. If buyers surpass this threshold and sustain the bullish momentum, the uptrend could continue toward the 100-day moving average of $7.2. Conversely, if the price is rejected at this resistance, Polkadot will likely enter a consolidation phase within the $5.5-$6.3 range.

The 4-Hour Chart
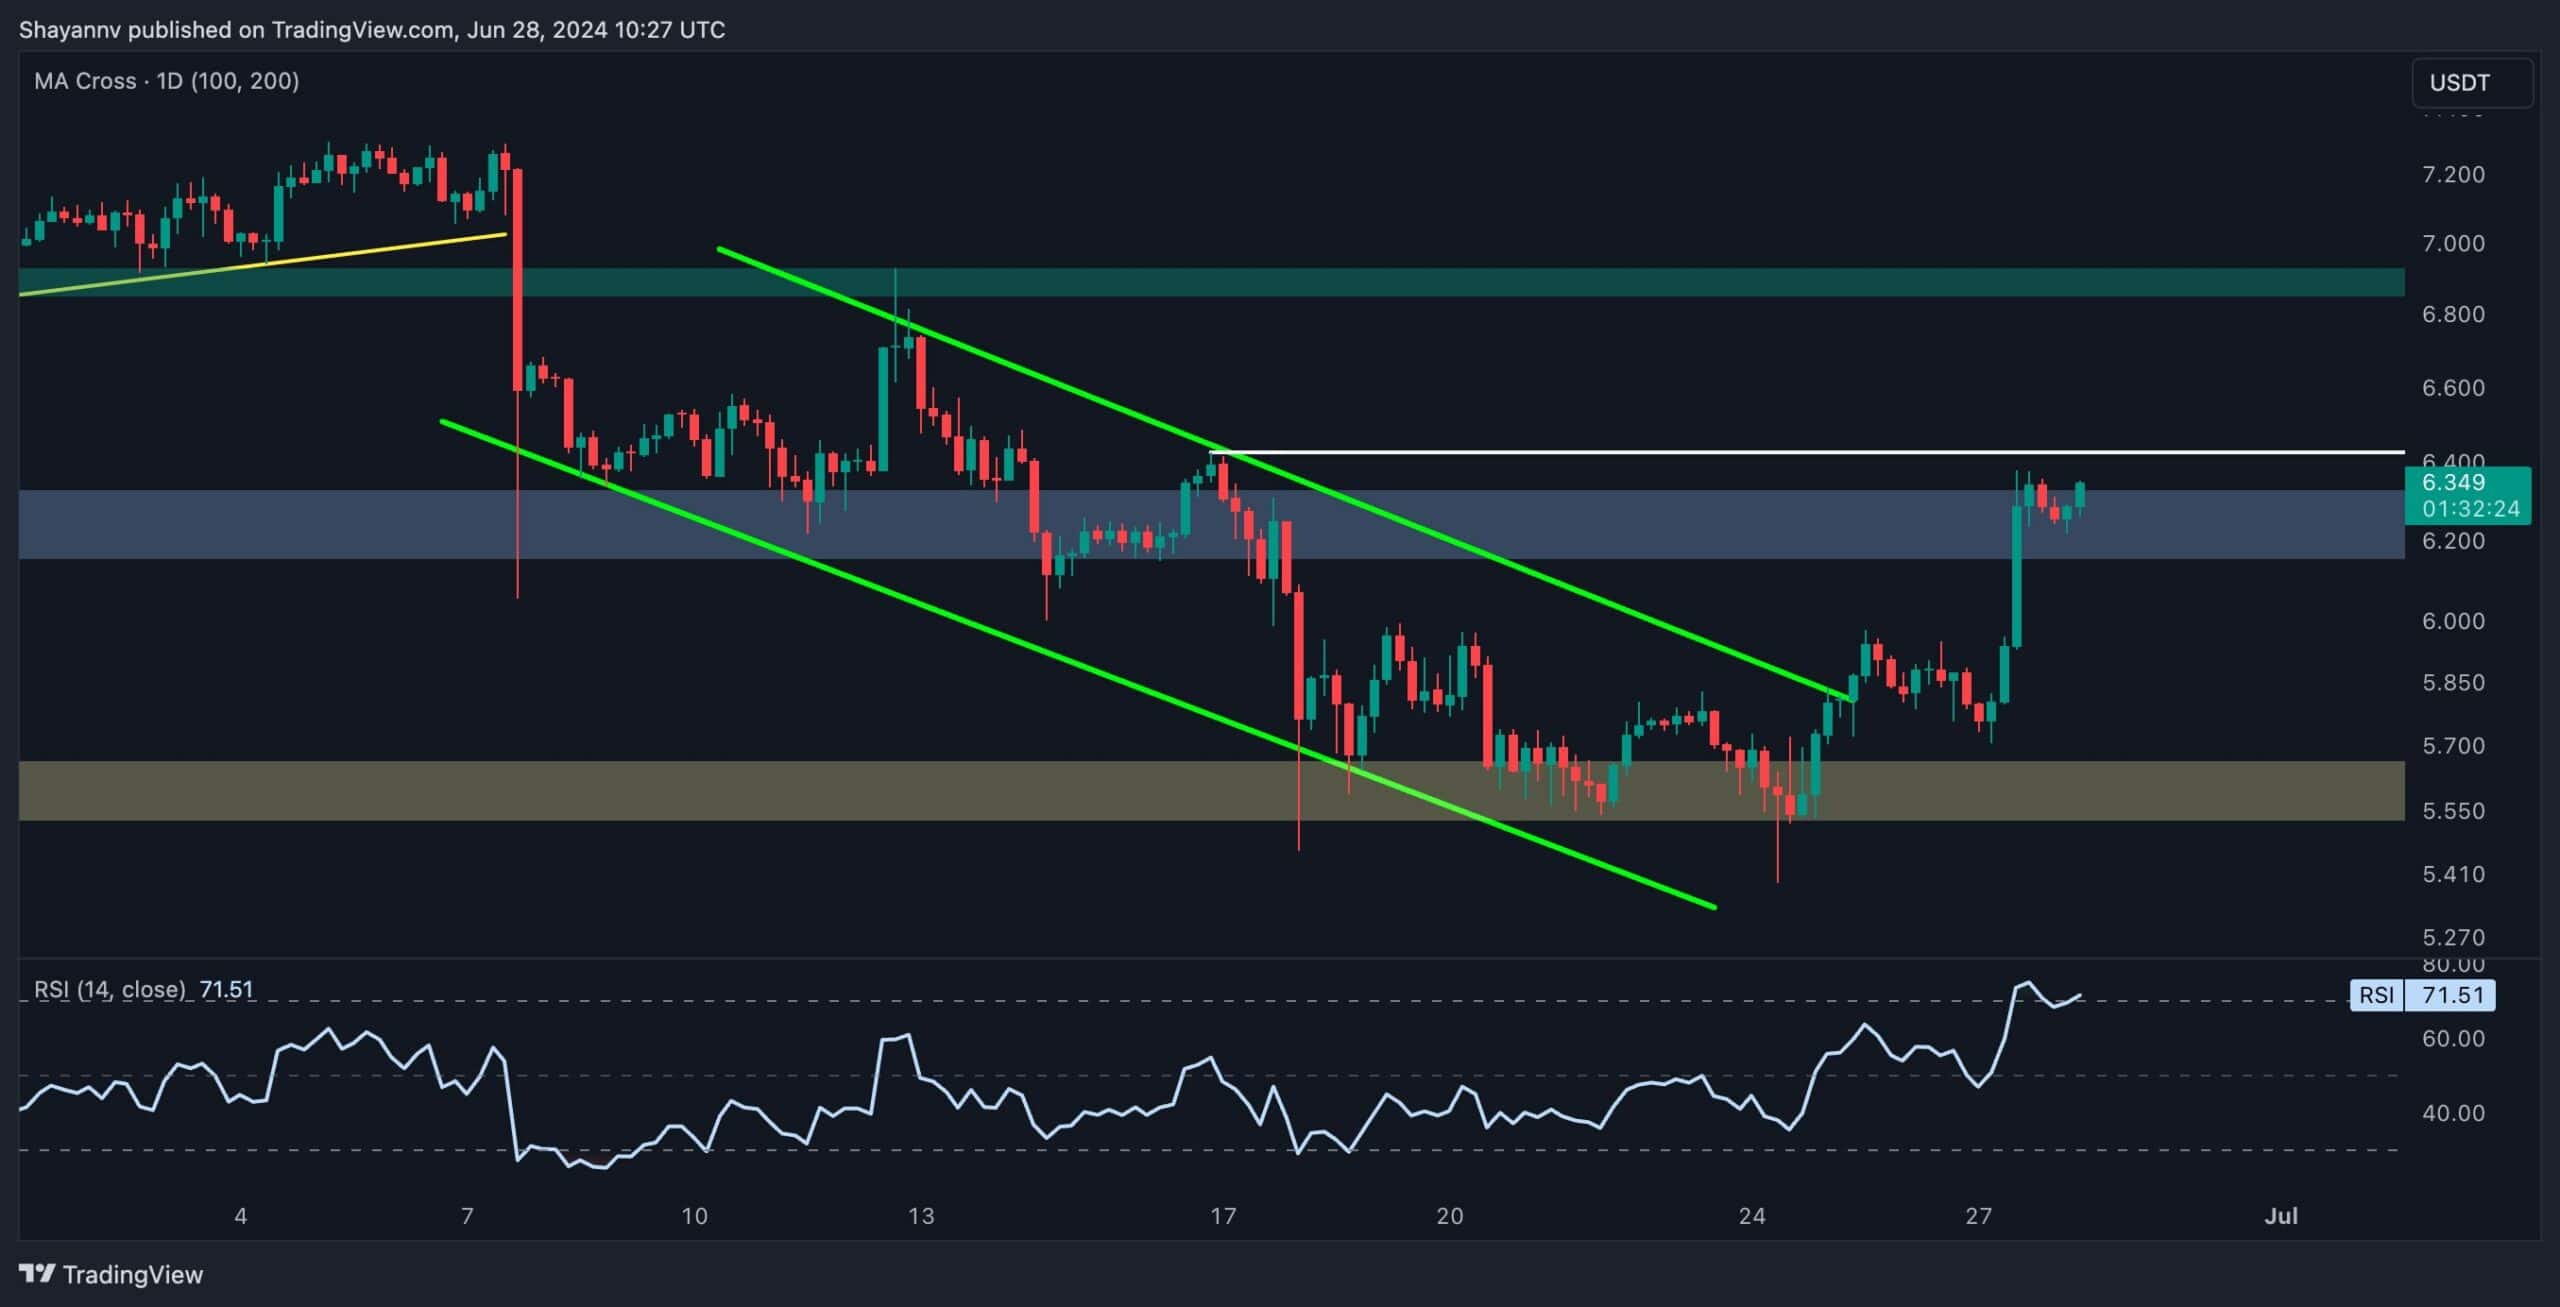
The 4-hour chart provides further insights into Polkadot’s price action. Following a break above the descending price channel, the price printed a notable surge, indicating a revival in demand and buying pressure, possibly driven by activities in the perpetual markets.
DOT now confronts a critical resistance area, which includes the $6.3 resistance level and the previous major swing high of $6.428.
If Polkadot reclaims this resistance threshold, it could trigger a slight short-squeeze and shift market sentiment, leading to a sustained uptrend towards the $7 resistance region. However, if the price faces rejection at this level, a short-term consolidation phase is expected within the $6.3-$5.4 range. Hence, Polkadot’s price action in the upcoming days will be pivotal in determining its trajectory.

Sentiment Analysis
By Shayan
Polkadot has experienced a recent increase in demand, leading to a significant rise toward its previous major swing high of $6.3. Understanding the supply dynamics at this critical level is essential for making well-informed trading decisions.
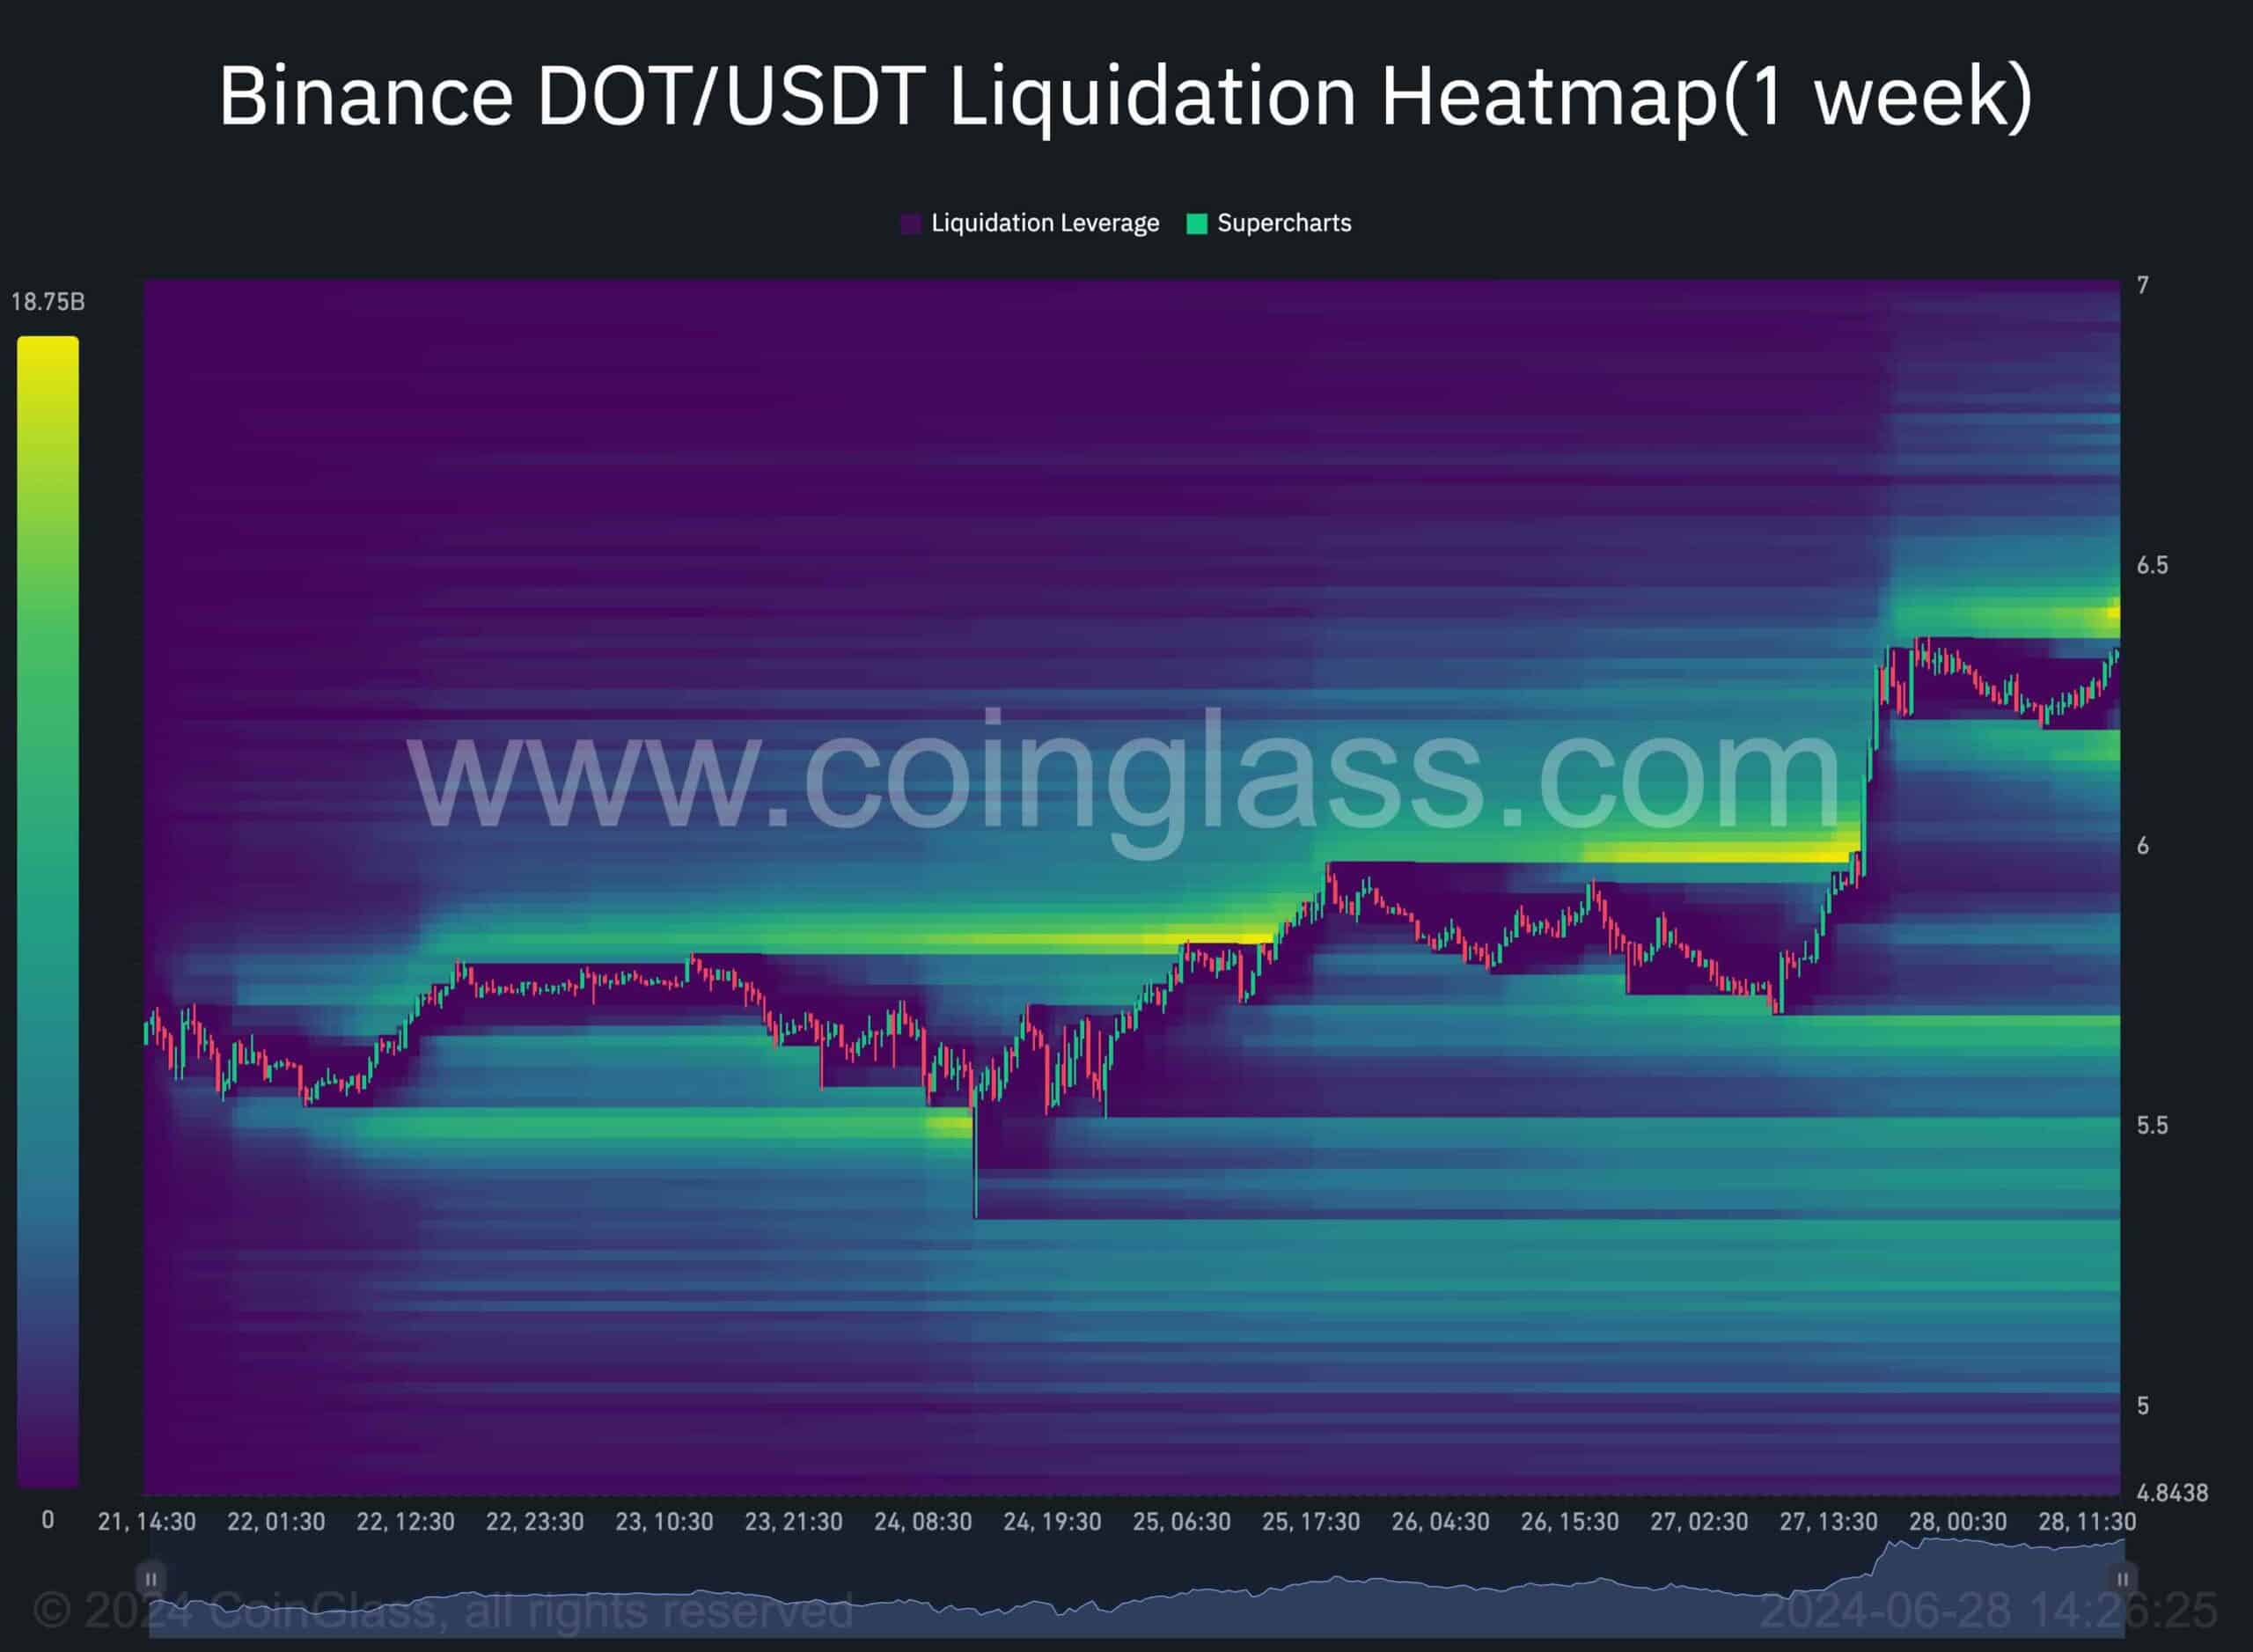
The accompanying chart illustrates potential liquidation zones within Polkadot’s price movements, providing crucial insights for mid-term strategies by smart money.
The chart reveals that the price has been targeting liquidity pools above its swing highs during the recent uptrend, reflecting bullish solid momentum and increased buying interest. Notably, substantial liquidity is concentrated above the critical $6.3 resistance level, which could be a short-term target for buyers aiming to reclaim this pivot and liquidate short positions.
Capturing this resting liquidity would enable buyers to sustain their upward momentum and drive the price higher in the mid-term. However, this level could also serve as a significant resistance point, and the forthcoming price action in this area will likely offer valuable insights into the future direction of Polkadot’s price.

The post Polkadot Price Analysis: DOT Soars 10% Weekly, Bear Trap Confirmed? appeared first on CryptoPotato.
Powered by WPeMatico


