


XRP Chart Signals Another Massive Move Ahead After Rally Pause
TL;DR
- XRP rallied 61% from $2.27 to $3.65 before stalling into a falling wedge pattern.
- Support near $2.70 holds firm, but exchange balances above 3.55B XRP raise selling pressure.
- Analysts compare XRP’s structure to 2017, projecting $5–$7 if $3.25 resistance breaks.
Symmetrical Triangle Breakout and Rally
From December 2024 to July 2025, XRP oscillated inside a symmetrical triangle, creating lower highs and higher lows as volatility contracted. The asset exited this structure in mid-July and rallied some 61% by moving up from $2.27 to hit the highs of $3.65.
The breakout marked the strongest push in months. However, the advance paused at $3.65, where resistance capped further upside, and the price started to consolidate.
After topping at $3.66, XRP entered a correction and built a falling wedge pattern. This structure, defined by converging downward trendlines, often precedes bullish reversals. The asset is now trading near $2.82, with support holding firm on several retests.
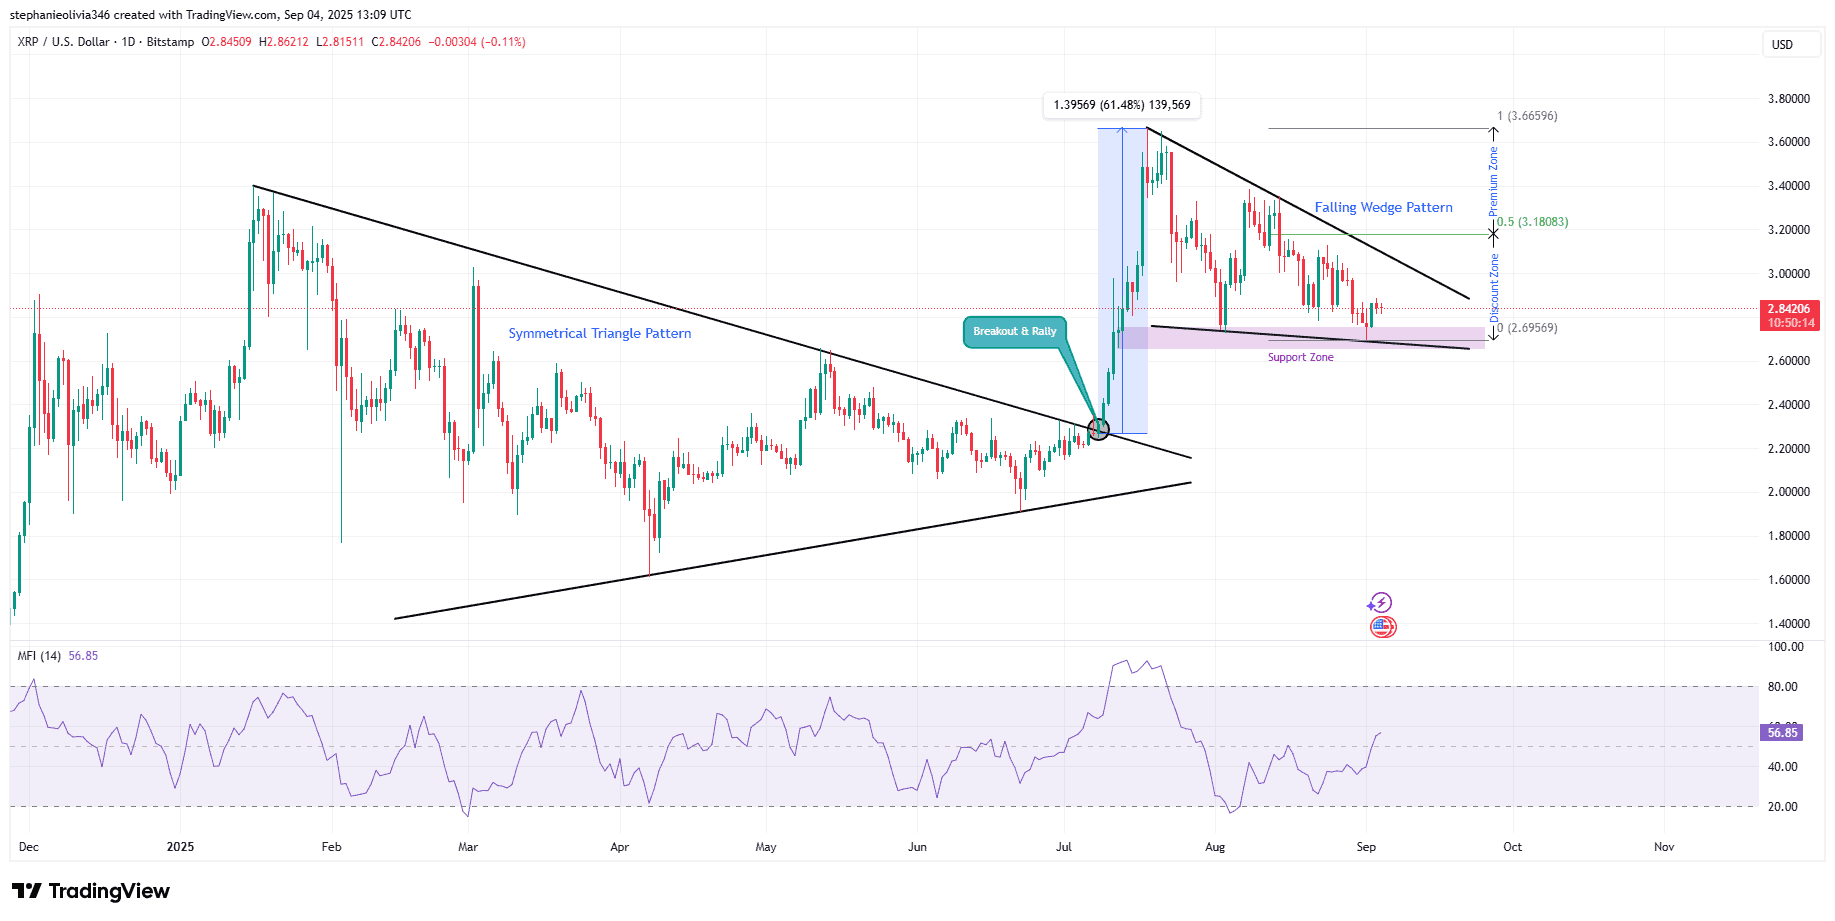
Notably, support is clustered around $2.70–$2.69, a level tested several times. If this floor breaks, losses could extend toward $2.50–$2.40. Resistance sits at $3.00–$3.10, with a breakout there opening the path toward $3.18 and potentially back to $3.65.
Indicators and Analyst Views
The money flow index (MFI 14) says 56.85, indicating steady buying pressure but not yet overbought territory. XRP, therefore, remains neutral-to-bullish while consolidating between these price points.
Analyst CRYPTOWZRD linked today’s structure to XRP’s past cycles:
“$XRP is identical to 2017’s Bull Run Structure… the longer it consolidates the bigger the explosion.”
Weekly charts echo this, showing repeated long consolidations that have historically ended in strong upward moves.
Exchange Balances Add a Cautionary Note
Despite bullish technical setups, exchange data signals caution. As CryptoPotato recently reported, the amount of XRP held on Binance has risen to over 3.55 billion tokens, a new all-time high. Such increases are often seen as preparation for selling, which could pressure prices in the short term.
At press time, XRP traded at $2.82, reflecting a 2% daily drop and a 5% decline over the week. The consolidation range between $2.00 and $3.25 remains decisive, as a breakout above $3.25 could open the path to $5.00–$7.00, consistent with XRP’s past cycle behavior.
The post XRP Chart Signals Another Massive Move Ahead After Rally Pause appeared first on CryptoPotato.
Powered by WPeMatico