

Will ETH Stabilize After a 20% Weekly Crash? Ethereum Price Analysis
Ethereum has been experiencing a wild crash over the last few days, breaking below several significant support levels. Investors are now wondering when this downtrend will end.
Technical Analysis
By Edris Derakhshi (TradingRage)
The Daily Chart
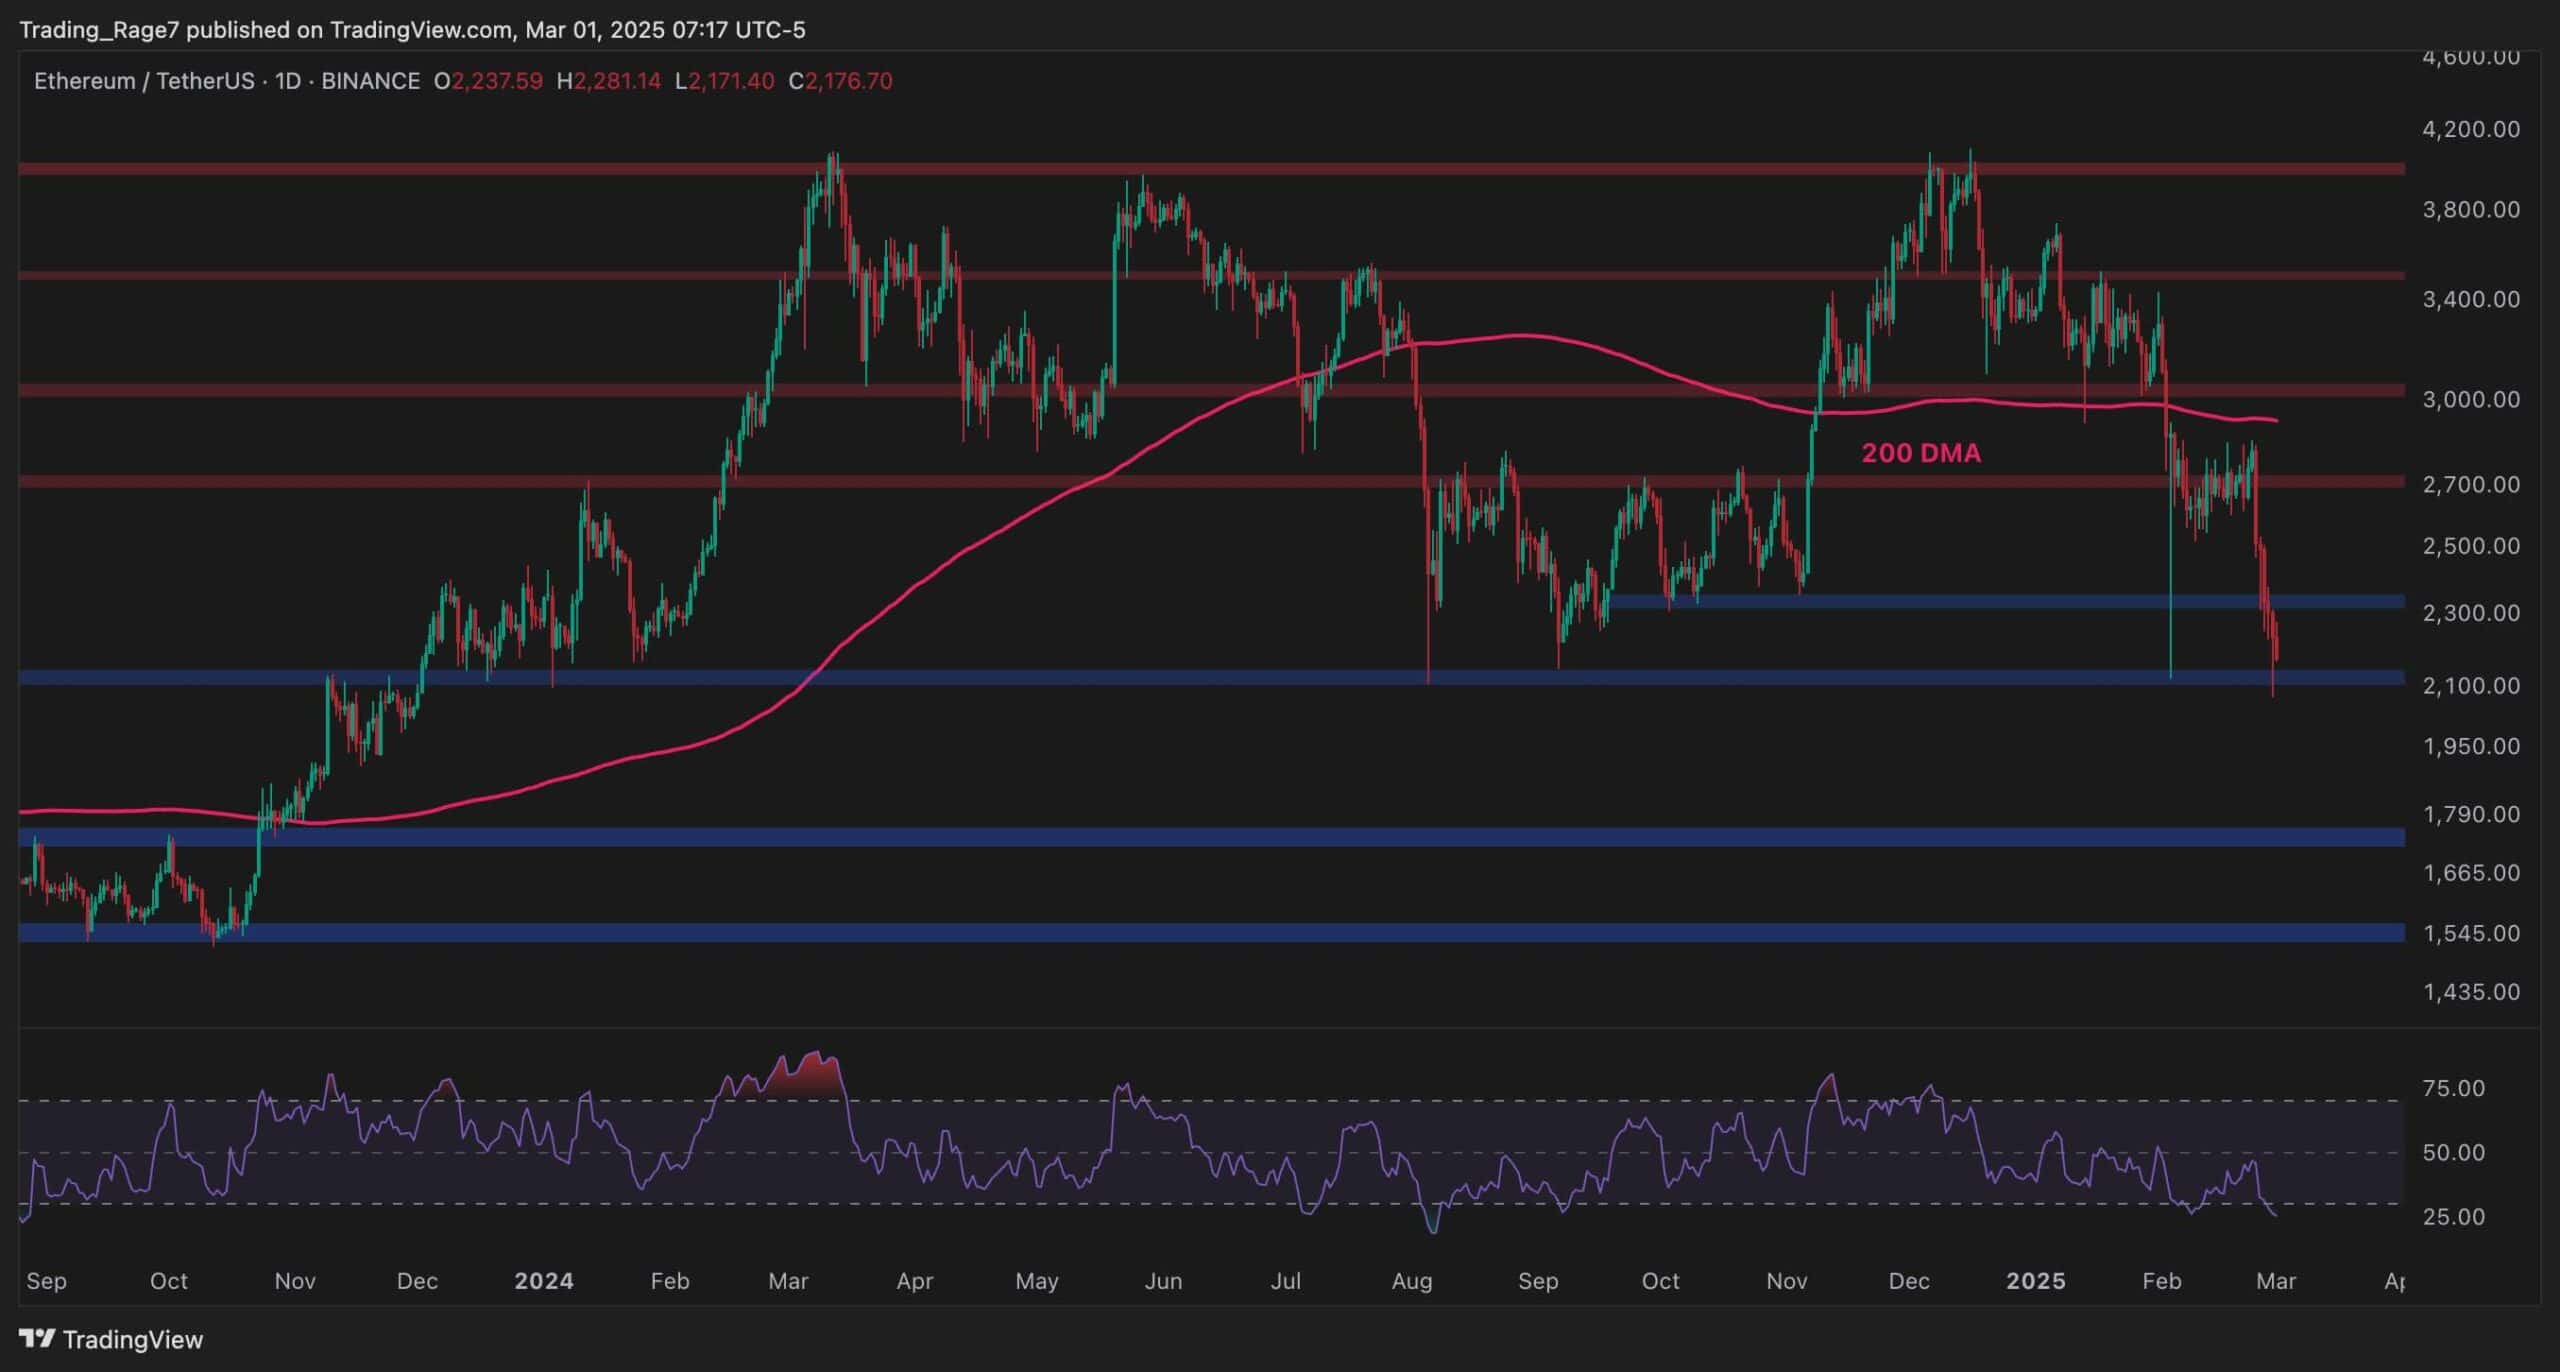
On the daily chart, the asset has been dropping rapidly since breaking below the 200-day moving average, located around the $2,900 mark.
The $2,700 and $2,350 levels are also broken to the downside, as the price is currently testing the $2,100 support zone. If this level also gets broken to the downside, a deeper decline toward the $1,750 level could be expected in the coming months.
The 4-Hour Chart
Looking at the 4-hour chart, things are not looking good at all for ETH, as the asset has been making lower highs and lows consistently over the last couple of months.
Currently, the $2,100 support level is holding the price. A temporary recovery could be probable if ETH breaks above the $2,400 level. However, if the $2,100 area is also lost, a much worse drop would be likely for Ethereum.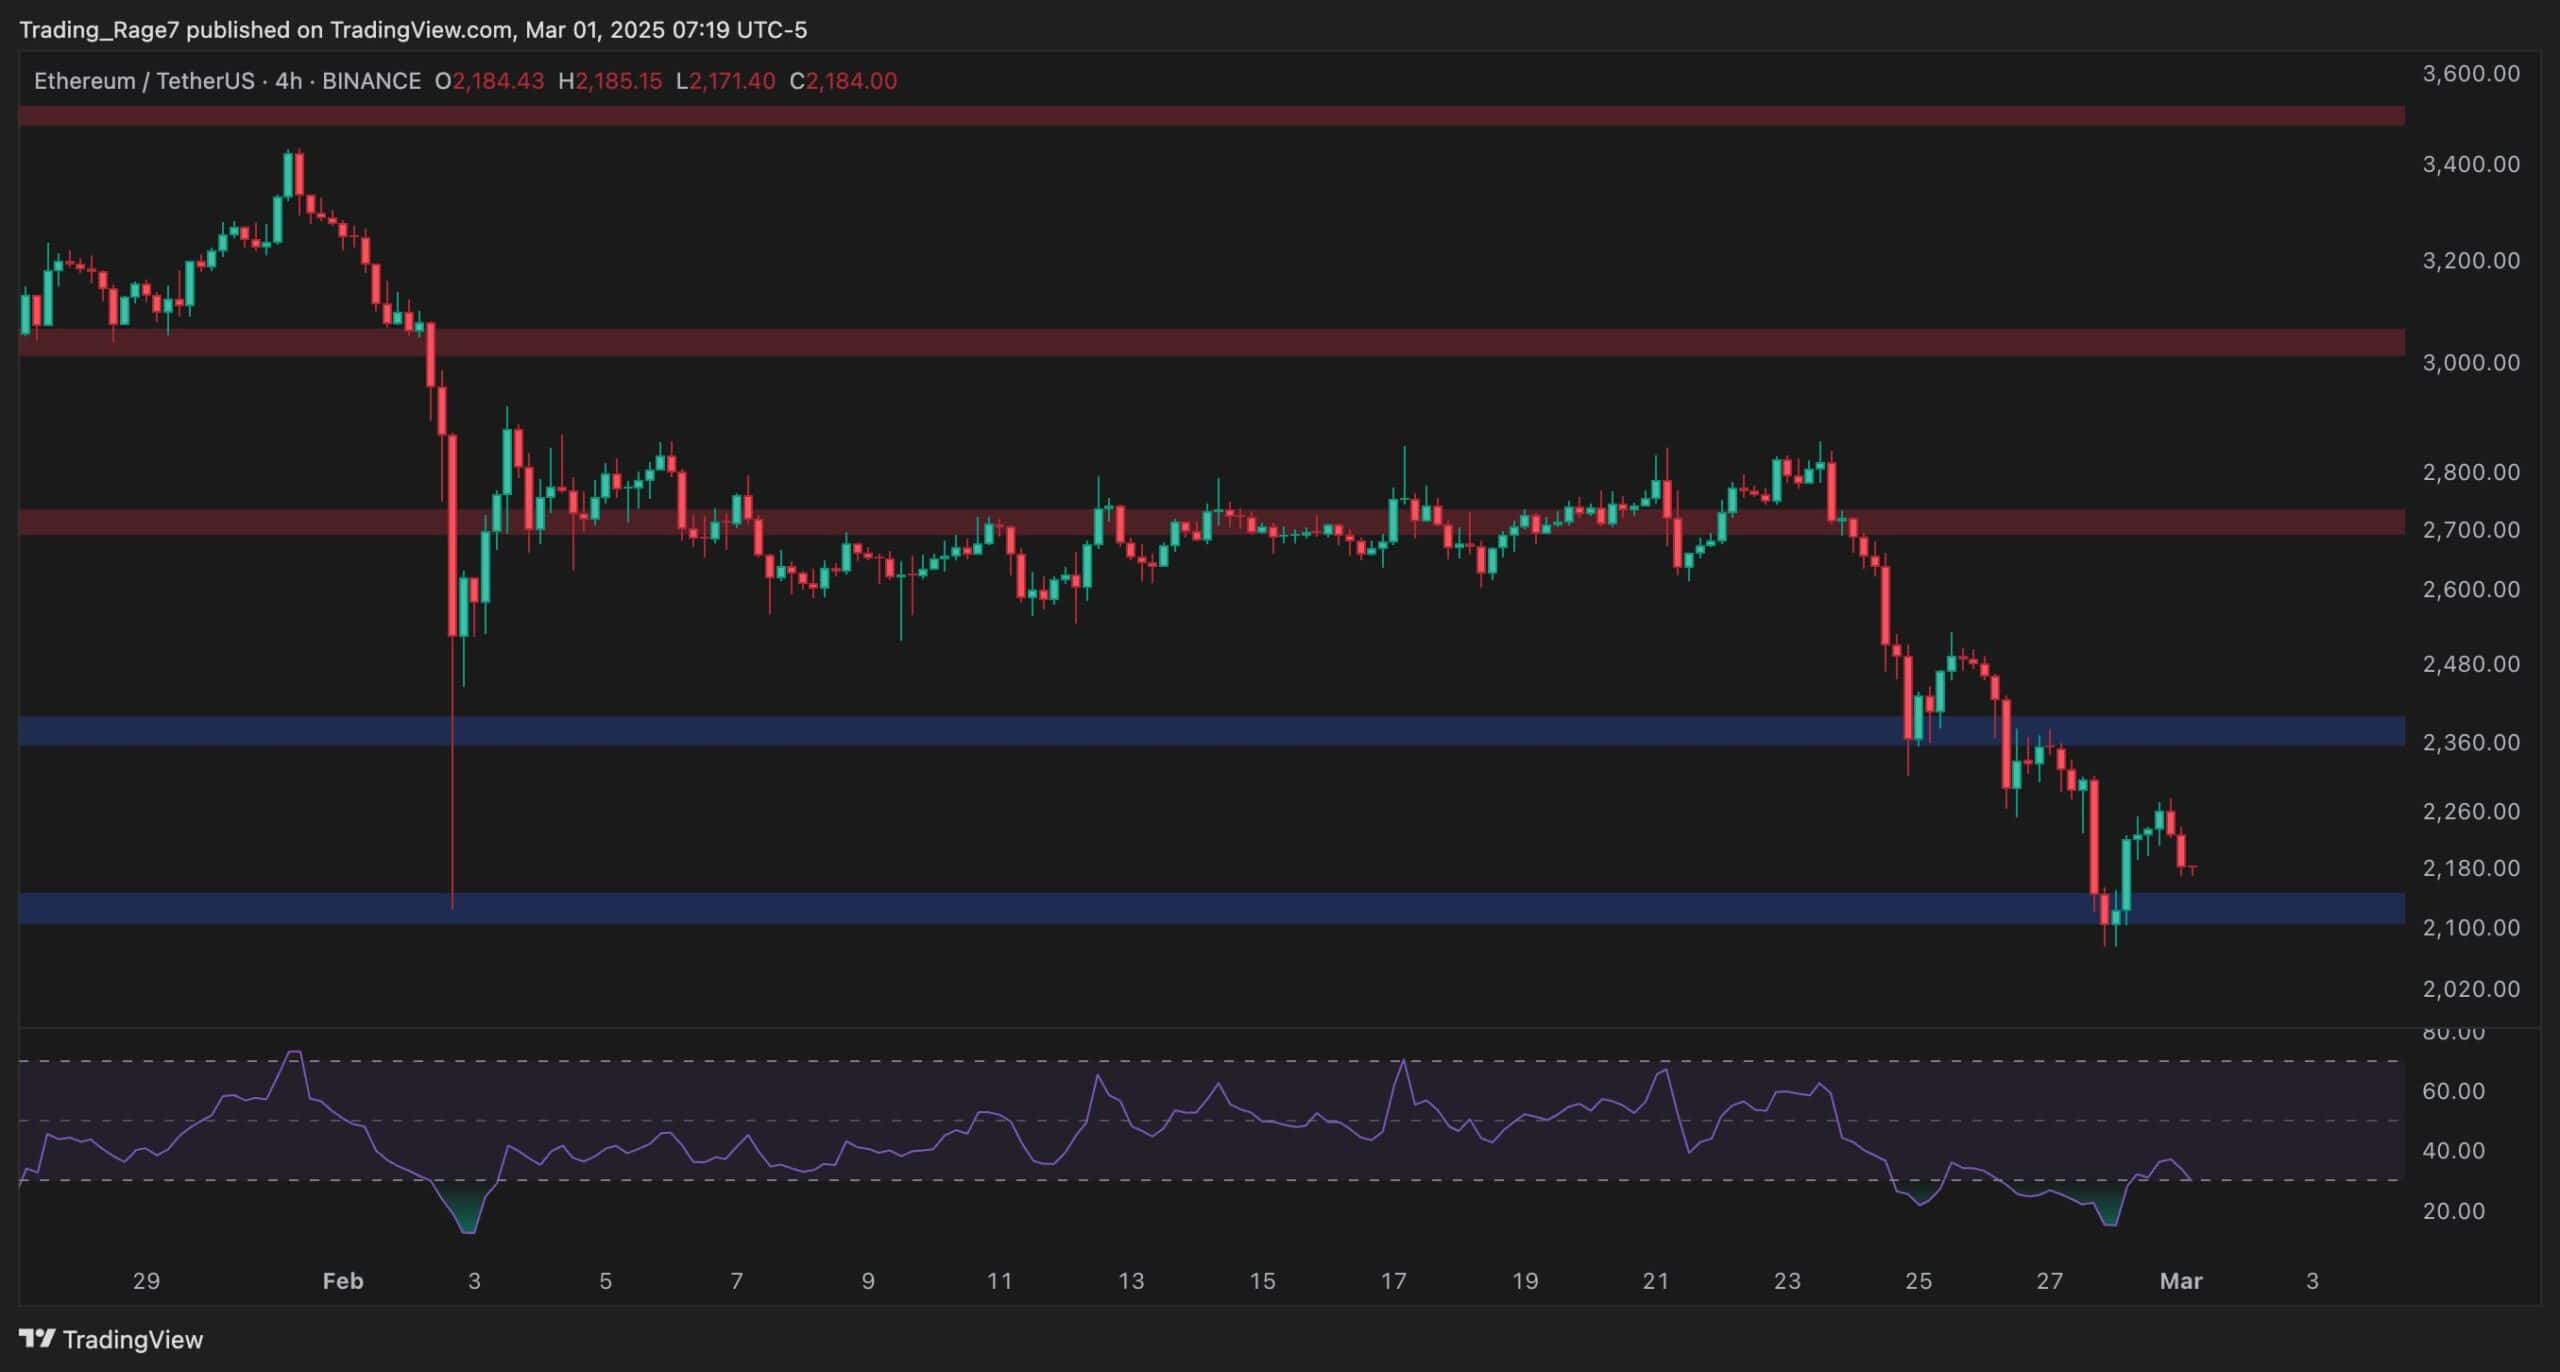
Sentiment Analysis
By Edris Derakhshi (TradingRage)
Open Interest
Many analysts and investors are blaming the futures market for Ethereum’s massive crash over the recent weeks. However, analyzing the open interest metric indicates this might not be the case this time.
This chart demonstrates the open interest metric, which measures the number of open futures contracts. As the chart suggests, while the price has experienced a significant drop, the open interest is not declining as it should be and is still lagging.
This indicates that the recent price action is not totally due to long liquidation cascades, and most of the selling pressure comes from the spot market. Also, it warns investors that things could get much worse in case a much bigger liquidation event occurs.
The post Will ETH Stabilize After a 20% Weekly Crash? Ethereum Price Analysis appeared first on CryptoPotato.
Powered by WPeMatico