

Ethereum Price Analysis: ETH Bulls Eye $4,000 But Consolidation Seems More Likely
Ethereum has reclaimed a crucial resistance region at the $3.5K mark, showcasing notable buying activity. Nevertheless, the price has now reached a critical order block around the $3.7K range, suggesting a potential period of consolidation before any further upside continuation.
Technical Analysis
By Shayan
ETH Price Analysis: The Daily Chart
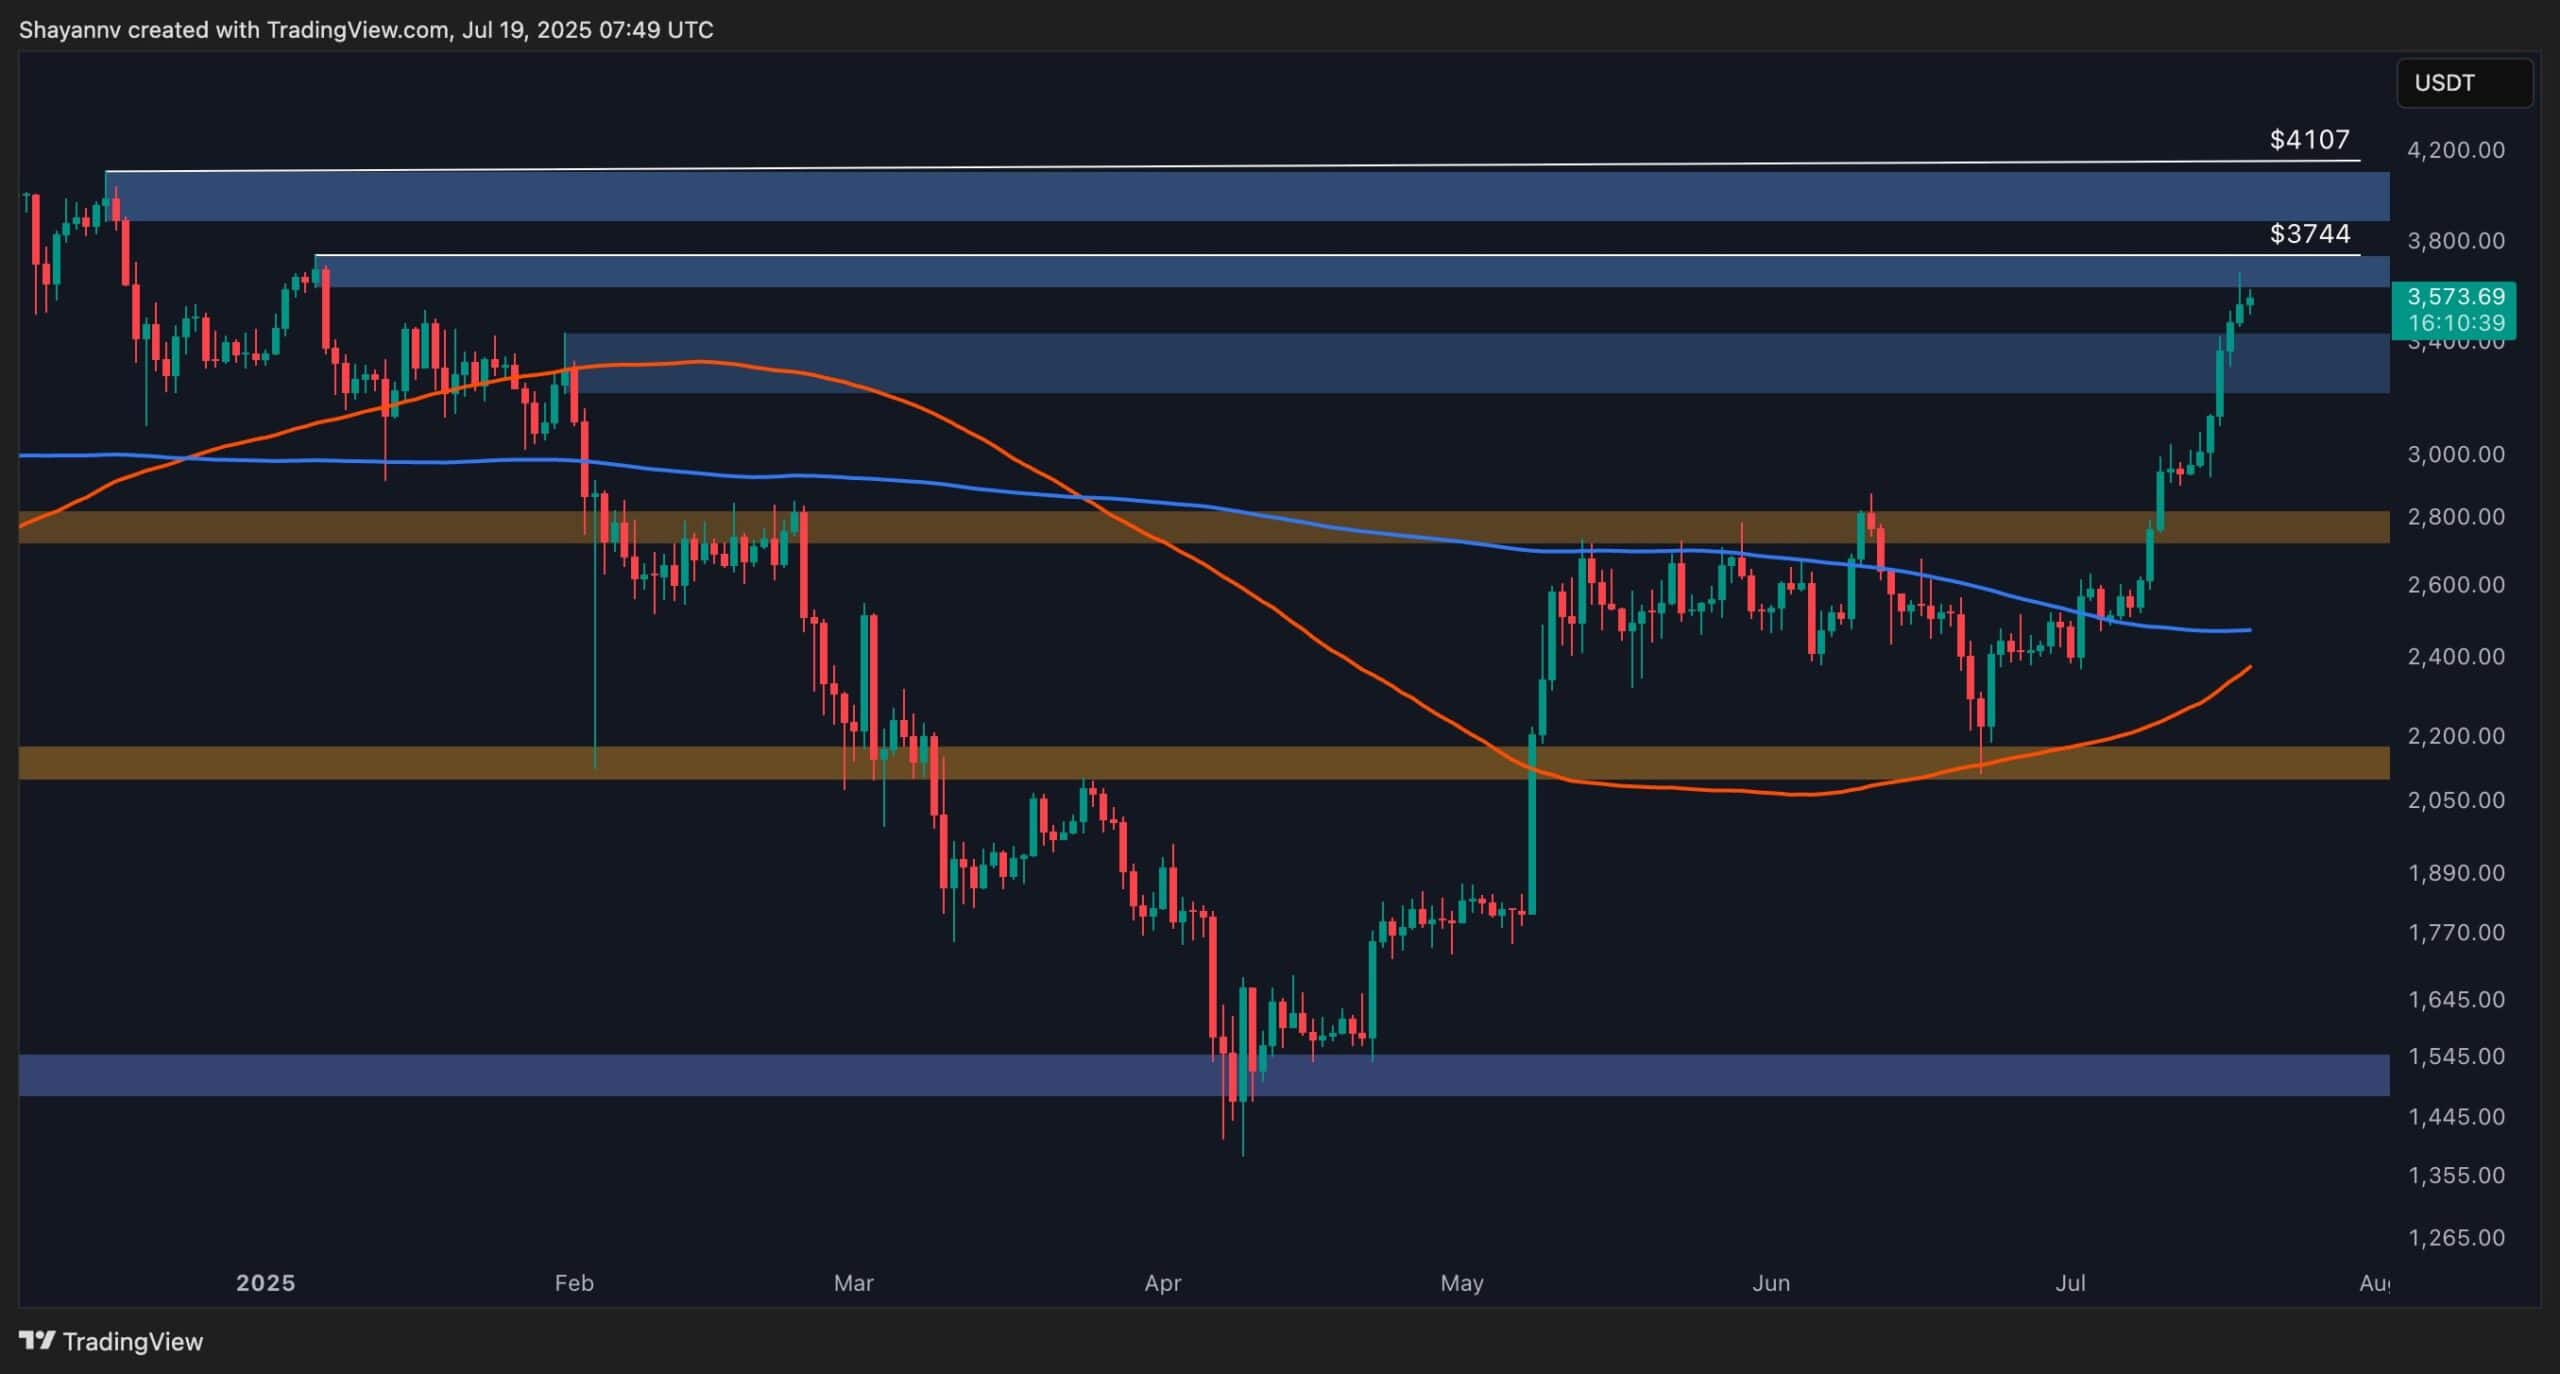
ETH has continued its bullish advance, reclaiming the significant psychological resistance at $3.5K. This move underscores strong market demand and growing investor confidence.
Adding to the bullish narrative, the 100-day moving average is nearing a crossover above the 200-day MA (currently around $ 2,476), signaling a potential golden cross —a classic long-term bullish indicator. Should it materialise, it could act as a catalyst for further upside momentum toward Ethereum’s all-time high.
However, the price is currently approaching a key supply zone (order block) in the $3.6K–$3.7K range. This zone is likely to introduce short-term headwinds, and a period of consolidation or mild correction is probable before any sustained breakout can occur.

The 4-Hour Chart
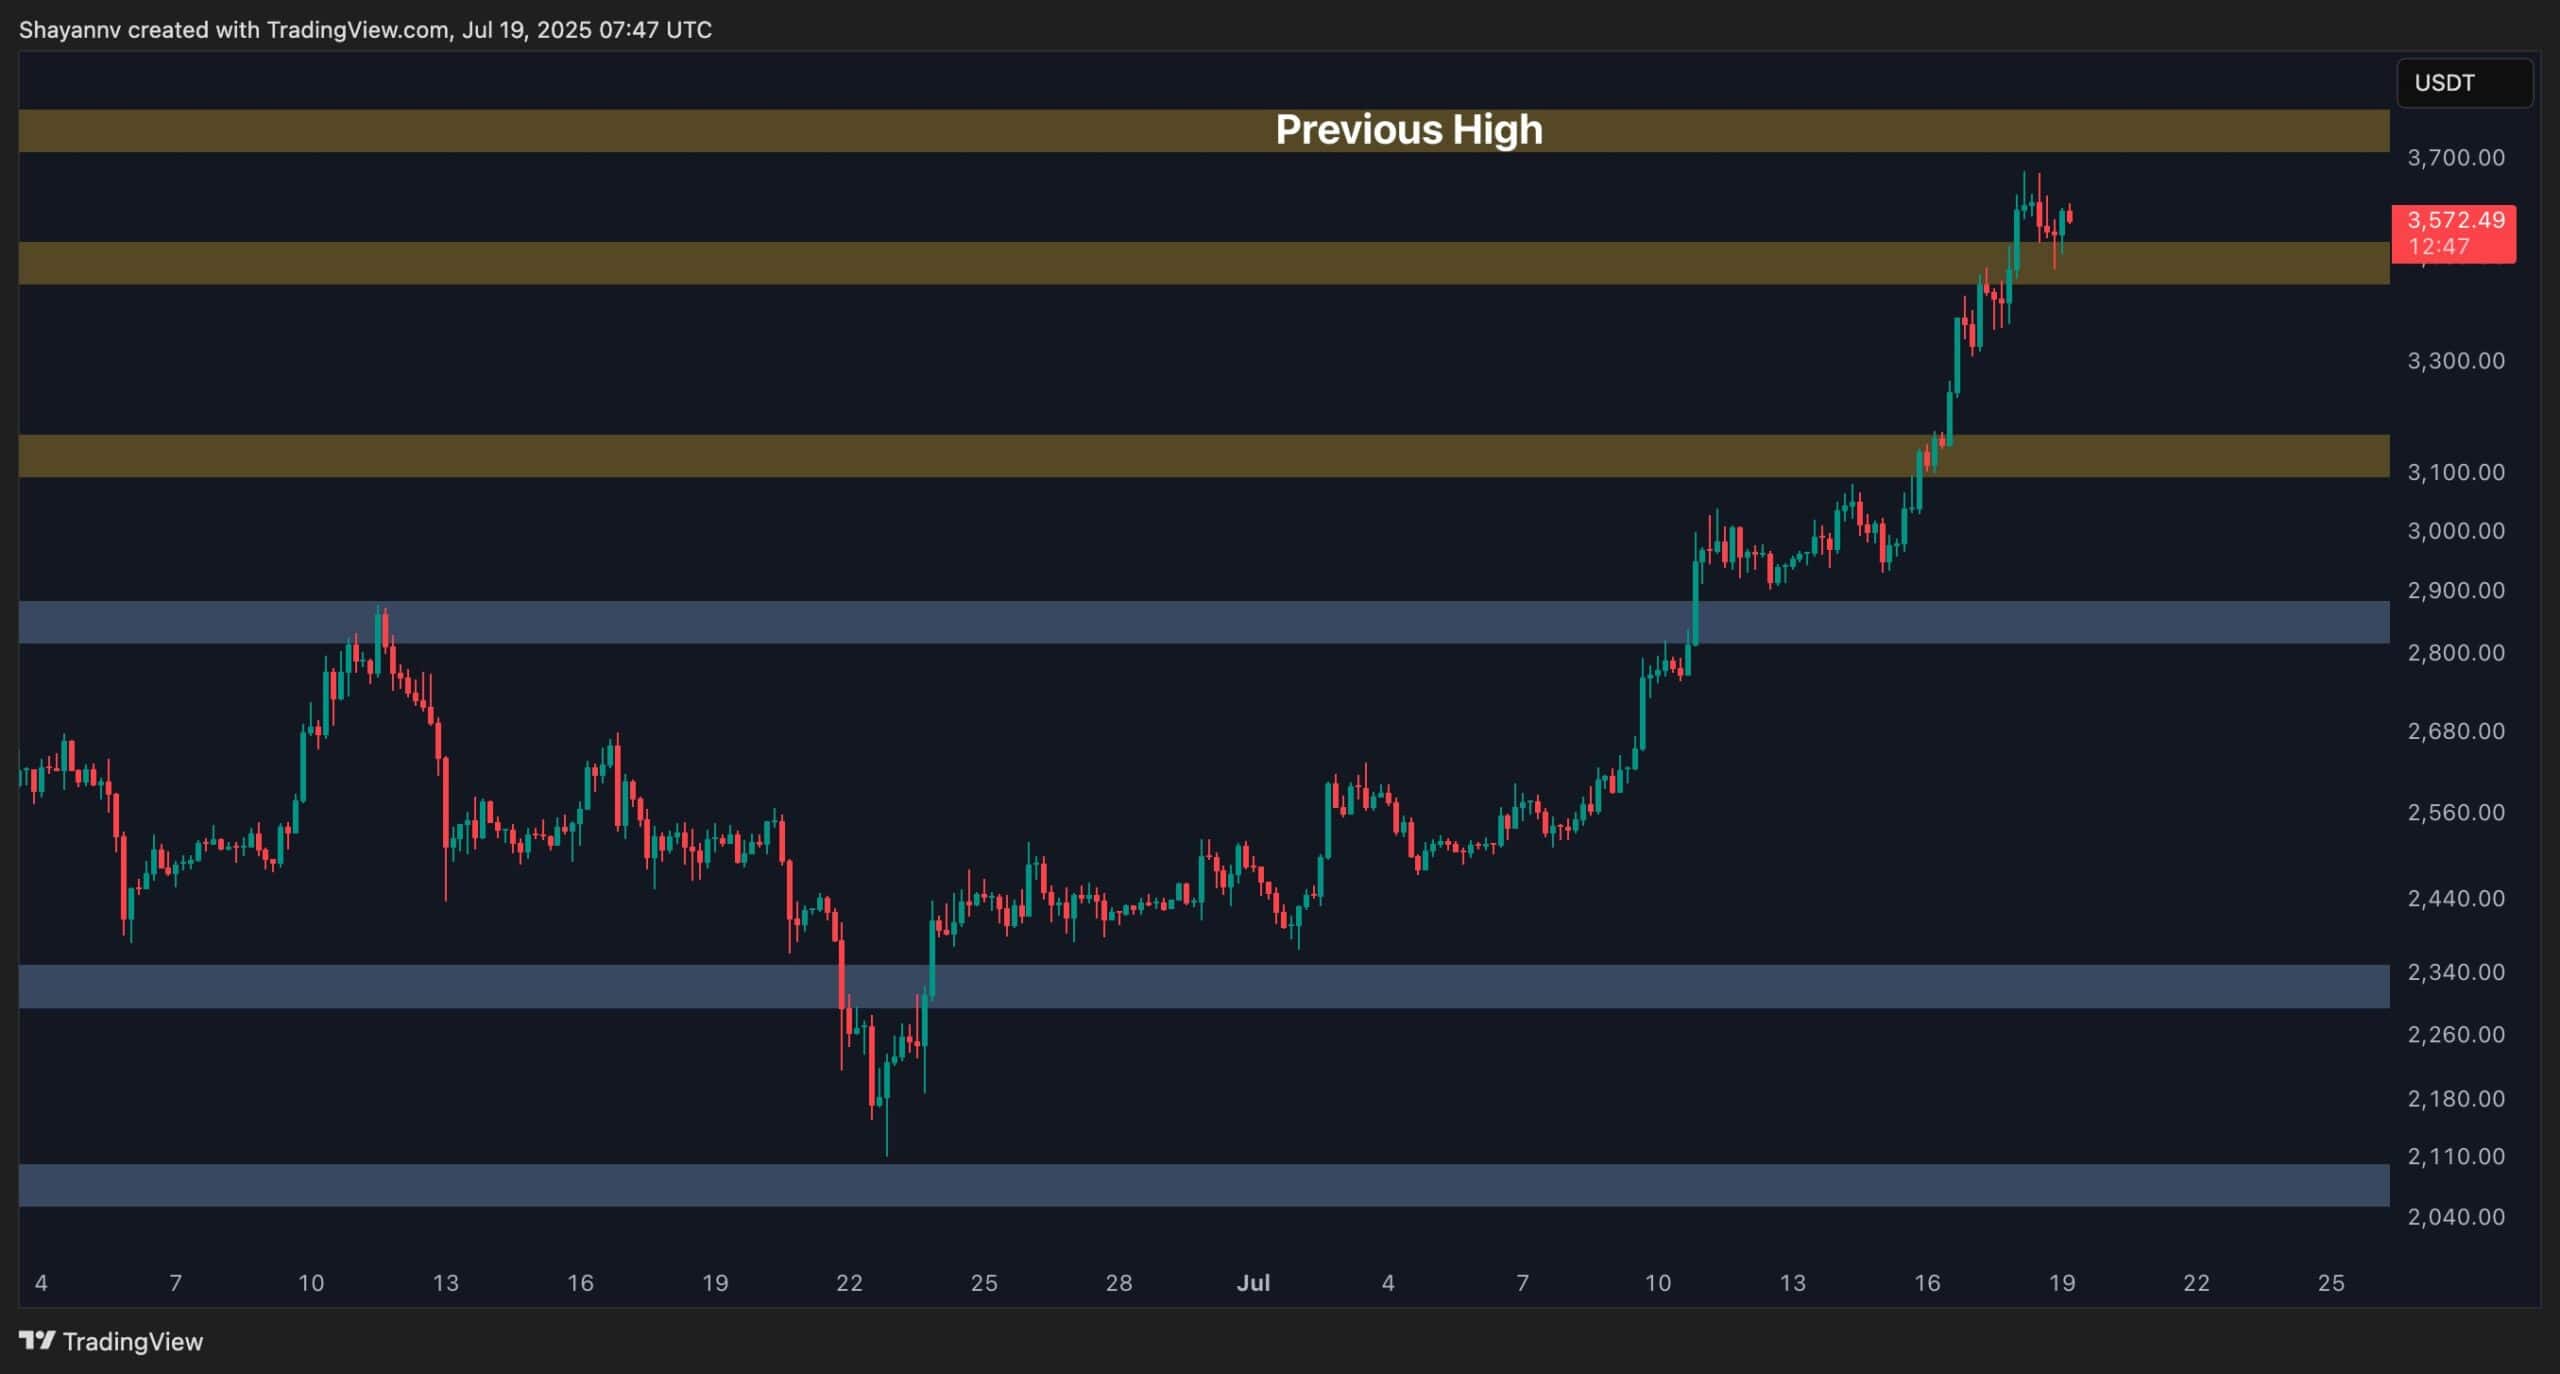
On the 4-hour timeframe, ETH has demonstrated impressive strength, slicing through multiple resistance levels with conviction.
The recent rally above the $3.5K zone reflects intensified buying pressure; however, the price action now finds itself boxed in between the $3.5K support and the $3.8K resistance. This narrow range suggests a consolidation phase is underway.
A short-term retracement toward the $3.5K level, now a potential support, is anticipated. If buyers defend this level, it could serve as a launchpad for a breakout above the upper boundary of the current range. Until then, continued sideways movement within this channel remains the most probable outcome.
Onchain Analysis
By Shayan
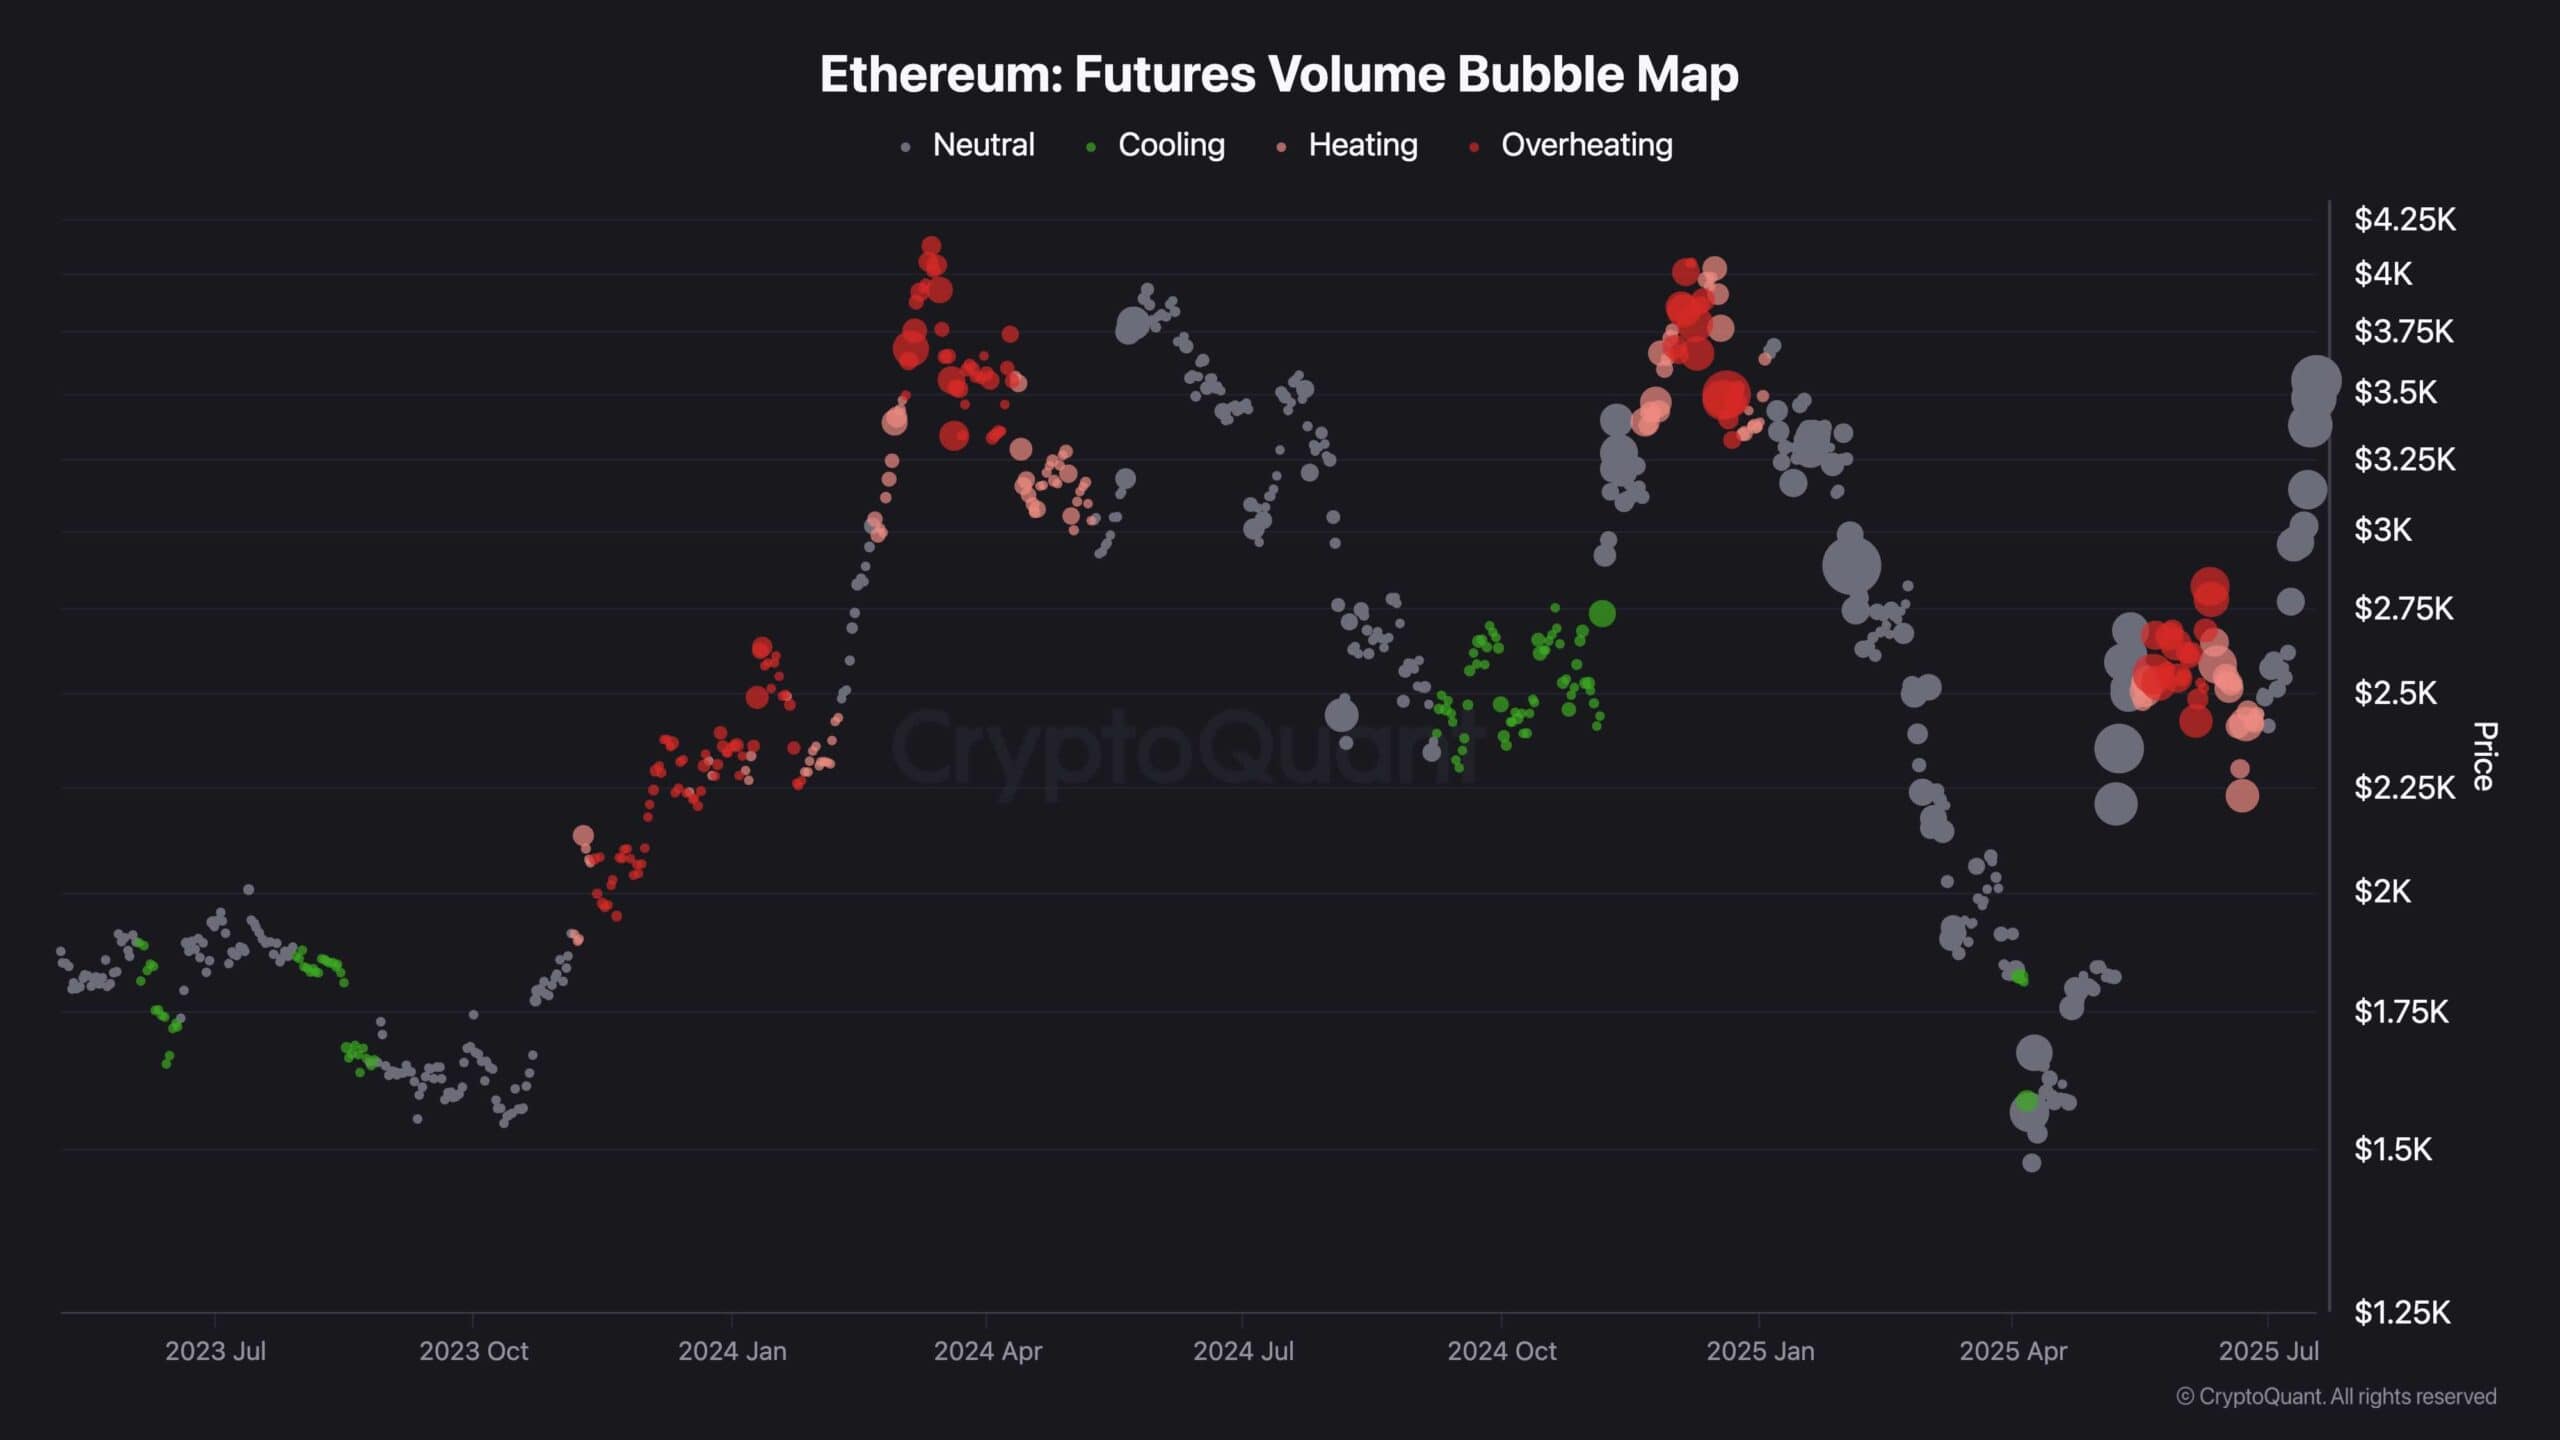
The Ethereum Futures Volume Bubble Map reveals clear signs of market overheating, especially in the regions highlighted by yellow circles. These zones show concentrated bursts in futures trading volume, signalling a sharp increase in leveraged positioning. This is often associated with short-term market euphoria and momentum-driven rallies. In ETH’s case, the surge in futures activity appears to have driven the recent price appreciation.
On the other hand, Ethereum’s Spot Volume Bubble Map paints a more subdued picture. Despite the strong upward price action, spot trading volumes have remained relatively flat and show no signs of overheating. This divergence suggests that while leveraged futures traders are aggressively participating, spot market buyers remain cautious or inactive, implying a lack of fundamental demand backing the move.
The current state of the market raises a key question: Can speculative futures-driven momentum evolve into broader spot market participation? If spot buyers begin entering the market in force, it would validate the rally and potentially expand it across the broader altcoin space.
The post Ethereum Price Analysis: ETH Bulls Eye $4,000 But Consolidation Seems More Likely appeared first on CryptoPotato.
Powered by WPeMatico